
Cloud Log Service (CLS) connects with Grafana, supporting the export of raw log data and SQL aggregated analysis results from CLS to Grafana for display. Users only need to install the CLS Grafana plug-in, fill in the search and analysis statement in Grafana, and the display result can be shown on Grafana.
Note: Starting from version 1.0.3, the plug-in uses the new retrieval interface of Tencent Cloud log service, making log queries more stable and quick.
For versions 1.0.2 and lower, retrieval abnormality may exist when querying raw Logs. Please proactively upgrade to the latest version as soon as possible.
Install Grafana 7 or later version. For details, see the Grafana installation guide. For legacy Grafana, refer to the Grafana upgrade guide.
For RPM-based Linux, you can use the source installation (recommended) or manual installation method
Start the TencentCloud Managed Service for Grafana (TCMG)
sudo systemctl daemon-reload
sudo systemctl start grafana-server
sudo systemctl status grafana-server
sudo systemctl enable grafana-server
To install more visual charts, such as pie charts and trend overview charts, run the command to install grafana panel plug-ins, for example, the pie panel.
grafana-cli plugins install grafana-piechart-panel
service grafana-server restart
For more plugin installation, see Grafana plugins
For different Grafana installation methods, you need to install the CLS data source plugin using the following different methods.
-
Please confirm the Grafana plug-in directory location. Install plug-in in the Centos plugin directory /var/lib/grafana/plugins/, then restart grafana-server.
cd /var/lib/grafana/plugins/
timeout 60s wget --timeout=10 --tries=1 -O tencent-cls-grafana-datasource.zip https://github.com/TencentCloud/cls-grafana-datasource/releases/latest/download/tencent-cls-grafana-datasource.zip || wget -O tencent-cls-grafana-datasource.zip https://cnb.cool/tencent/cloud/cls/frontend/cls-grafana-datasource/-/releases/latest/download/tencent-cls-grafana-datasource.zip
unzip tencent-cls-grafana-datasource
Or use the one-click installation script (parameter at the end is the plug-in installation directory).
/bin/bash -c "$(curl -fsL --max-time 10 https://raw.githubusercontent.com/TencentCloud/cls-grafana-datasource/master/toolkit/update.sh || curl -fsSL https://cnb.cool/tencent/cloud/cls/frontend/cls-grafana-datasource/-/git/raw/main/toolkit/update_from_cnb.sh)" bash /var/lib/grafana/plugins/
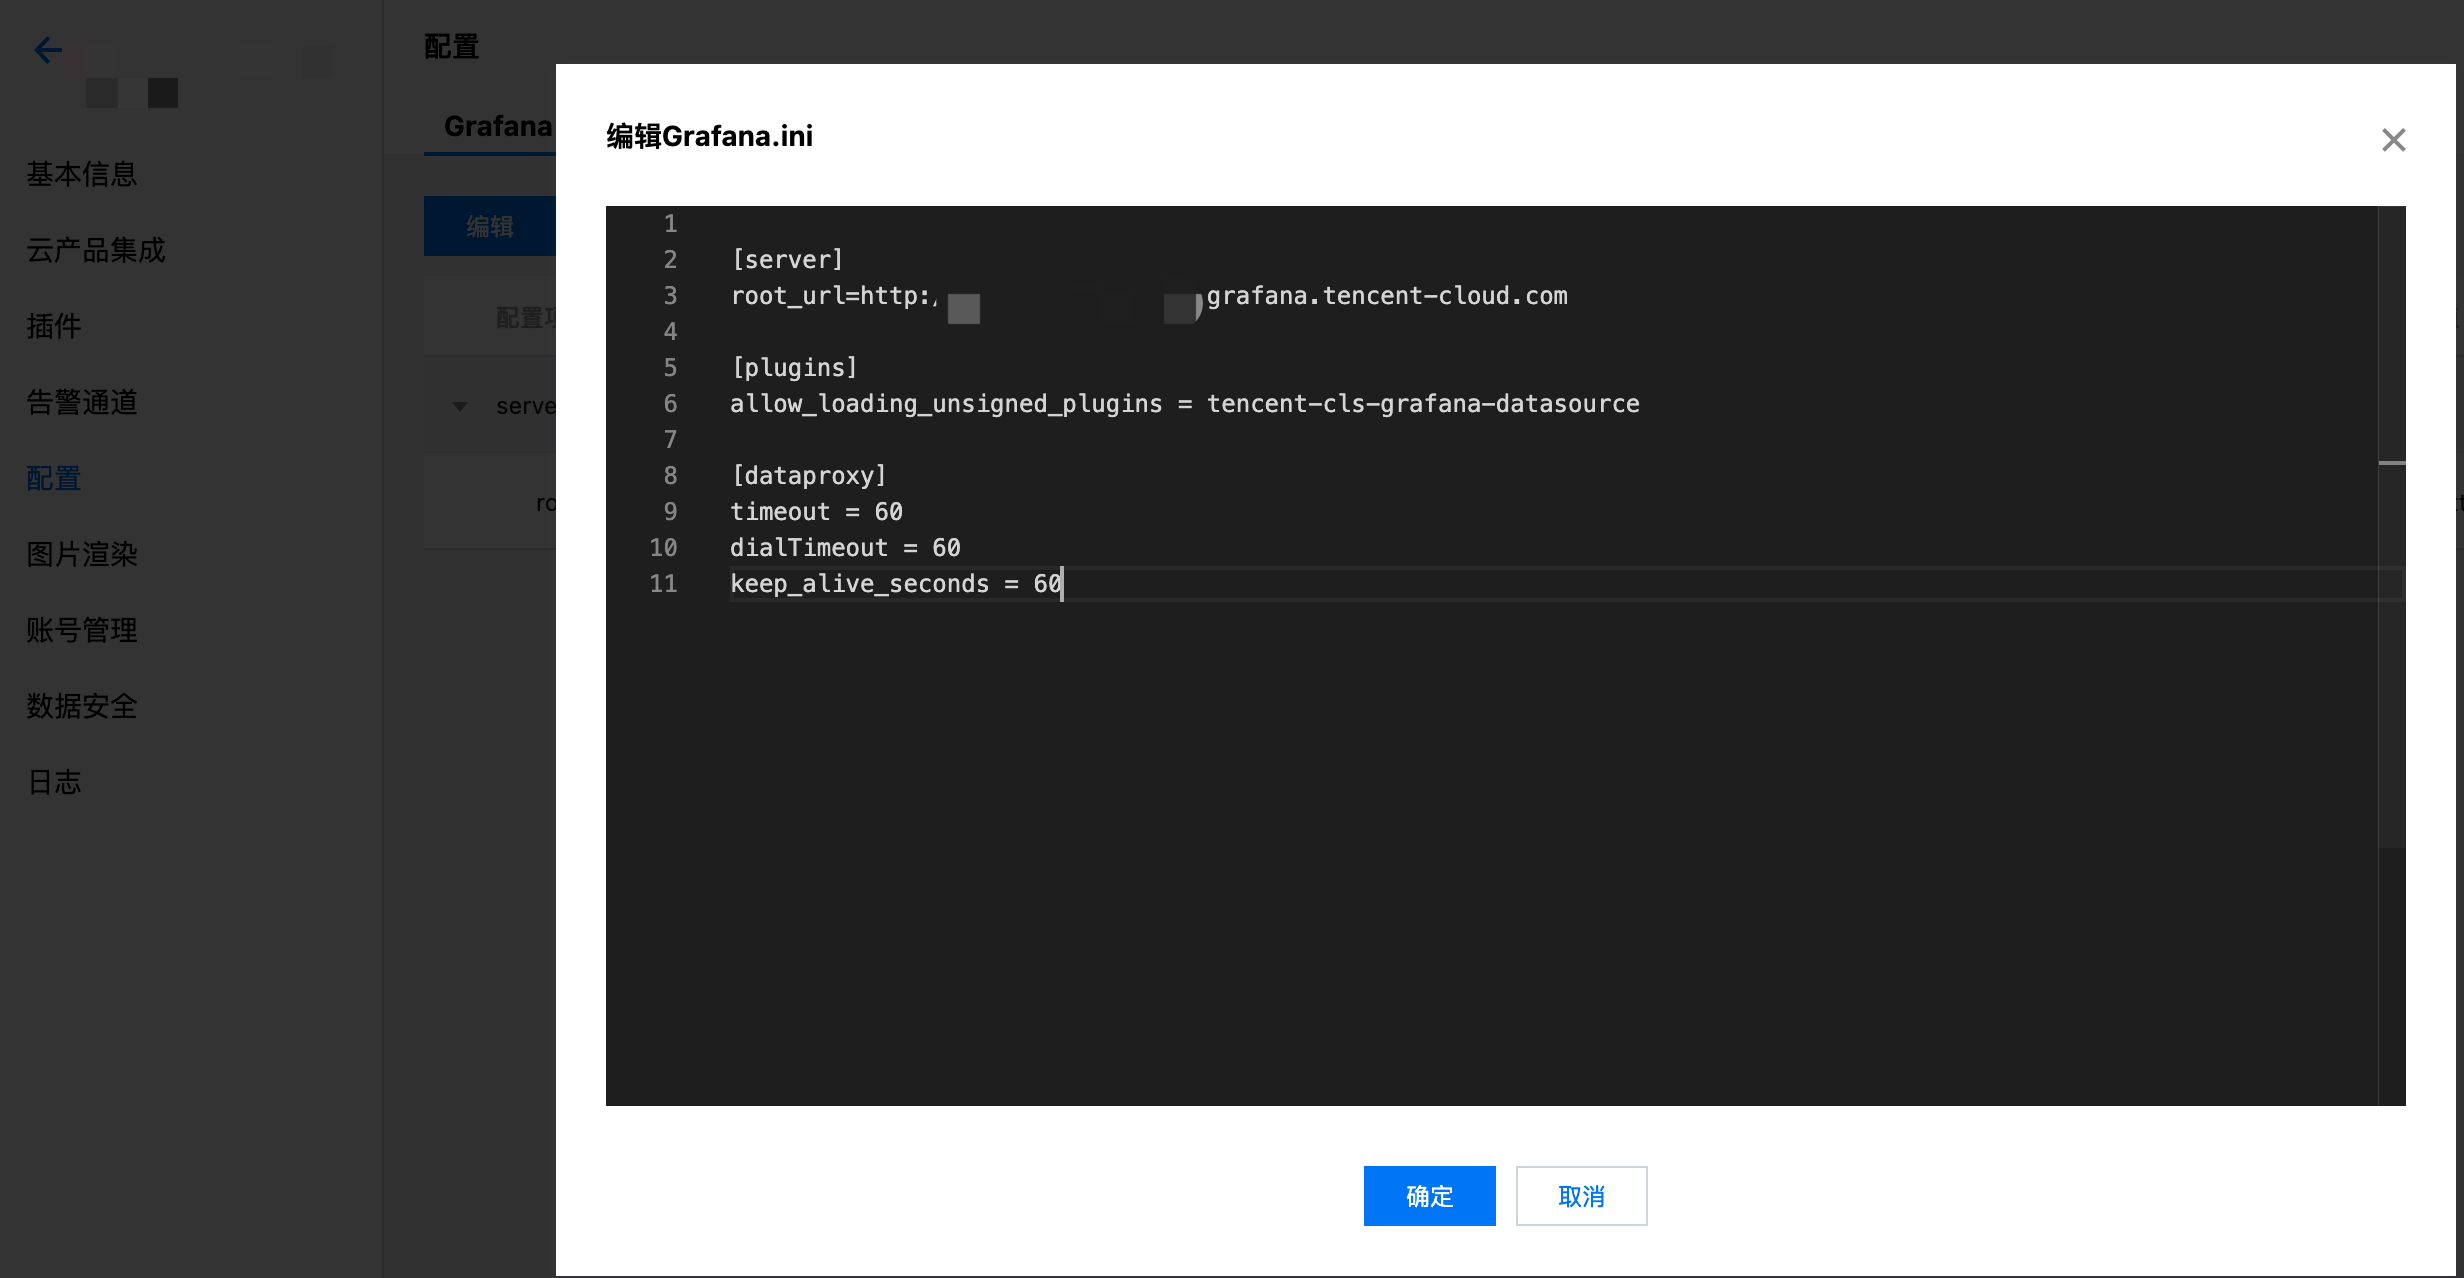
- Modify the Grafana configuration file to configure the CLS data source ID. For the path to the configuration file, see the configuration document
-
- Set the allow_loading_unsigned_plugins parameter in plugins
[plugins]
allow_loading_unsigned_plugins = tencent-cls-grafana-datasource
-
- Set the timeout, dialTimeout, and keep_alive_seconds parameters in dataproxy
[dataproxy]
timeout = 60
dialTimeout = 60
keep_alive_seconds = 60
- Restart the grafana service
service grafana-server restart
Refer to the plugin guide for Grafana installation in Docker and install the CLS plug-in using the following environment variable.
docker run command:
docker run -d -p 3000:3000 --name=grafana \
  -e "GF_INSTALL_PLUGINS=https://github.com/TencentCloud/cls-grafana-datasource/releases/latest/download/tencent-cls-grafana-datasource.zip;tencent-cls-grafana-datasource" \
  -e "GF_PLUGINS_ALLOW_LOADING_UNSIGNED_PLUGINS=tencent-cls-grafana-datasource" \
  -e "GF_DATAPROXY_TIMEOUT=60" \
  -e "GF_DATAPROXY_DIALTIMEOUT=60" \
  -e "GF_DATAPROXY_KEEP_ALIVE_SECONDS=60" \
  grafana/grafana
docker compose:
version: '3'

services:
  grafana:
    image: grafana/grafana:latest
    container_name: grafana
    ports:
      - '3000:3000'
    environment:
      - GF_INSTALL_PLUGINS=https://github.com/TencentCloud/cls-grafana-datasource/releases/latest/download/tencent-cls-grafana-datasource.zip;tencent-cls-grafana-datasource
      - GF_PLUGINS_ALLOW_LOADING_UNSIGNED_PLUGINS=tencent-cls-grafana-datasource
      - GF_DATAPROXY_TIMEOUT=60
      - GF_DATAPROXY_DIALTIMEOUT=60
      - GF_DATAPROXY_KEEP_ALIVE_SECONDS=60
- If accessing the docker software source is slow on Tencent Cloud CVM, see Using Tencent Cloud Docker Software Source on Cloud Virtual Machine to speed up.
- If accessing github is slow, replace the
GF_INSTALL_PLUGINSenvironment variable withGF_INSTALL_PLUGINS=https://cnb.cool/tencent/cloud/cls/frontend/cls-grafana-datasource/-/releases/latest/download/tencent-cls-grafana-datasource.zip;tencent-cls-grafana-datasource
- Refer to configuration management and add the following configuration in Grafana configuration.
[plugins]
allow_loading_unsigned_plugins = tencent-cls-grafana-datasource

[dataproxy]
timeout = 60
dialTimeout = 60
keep_alive_seconds = 60
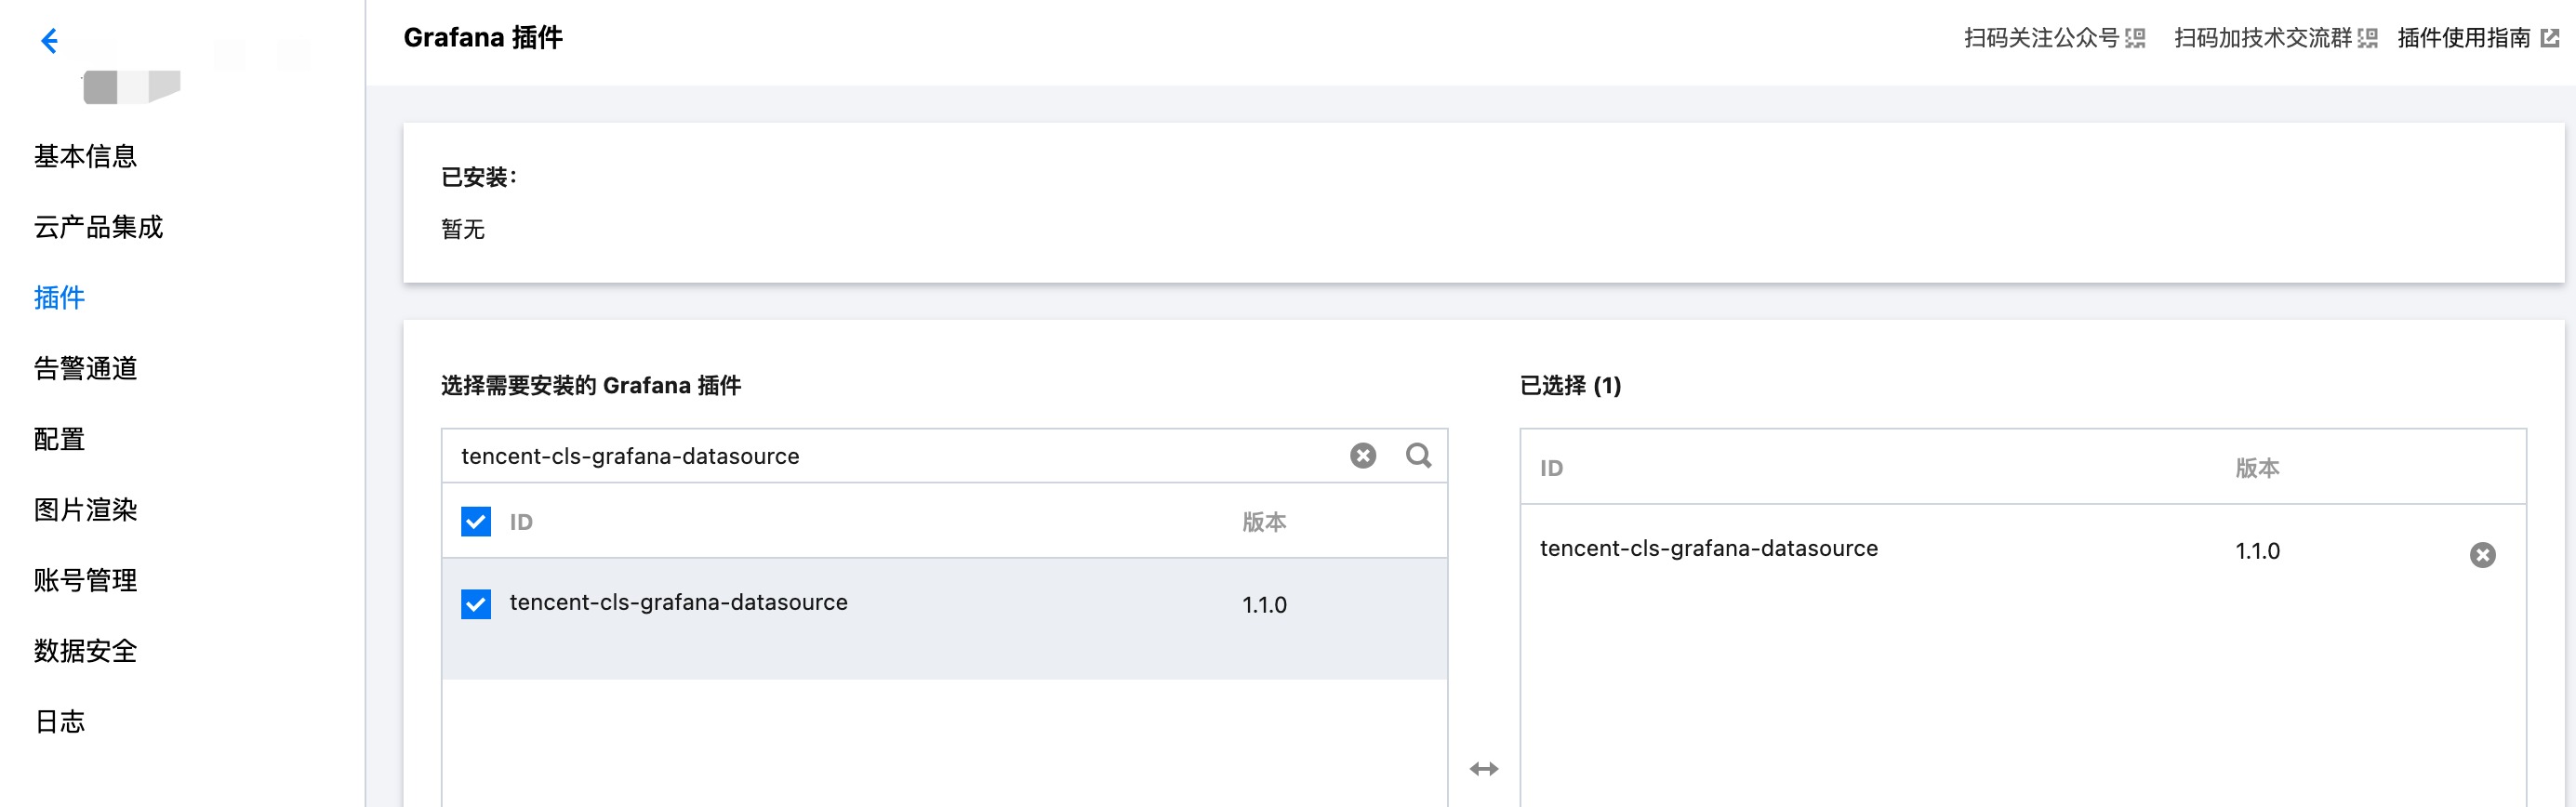
- Refer to install plugin and select tencent-cls-grafana-datasource.
- Log in to Grafana
If you deploy on the local machine, port 3000 is selected by default. Please advise in advance to open port 3000 in browser.
- Click the settings icon in the left menu bar to enter Data Sources.
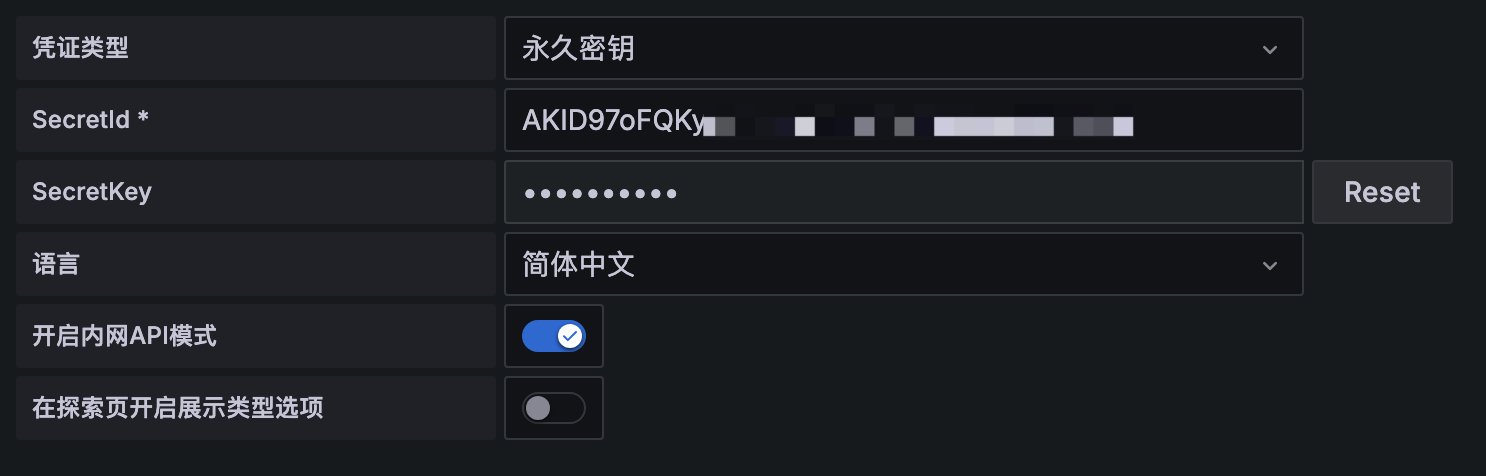
On the Data Sources page, click Add data source, select Tencent Cloud Log Service Datasource, and configure the data source according to the following instructions.
| Configuration Item | Description |
|---|---|
| Credential Type | "Permanent key": Initiate request by filling in SecretId and SecretKey; "Assume Role": Initiate request by obtaining temporary key after assuming role identity; "CVM Role": Initiate request by obtaining temporary key after assuming CVM-bound role. Supports only Grafana instances deployed on Tencent Cloud CVM. |
| SecretId, SecretKey | API request key for identity authentication. Go to API key management to get address. Fill in when credential Type is "permanent key" or "Assume Role". |
| RoleArn | The resource description of the role, which can be obtained by clicking the role name in Cloud Access Management (CAM). Fill in when the credential type is "Assume Role". |
| Role name | The role name can be obtained in Access Management (CAM). Fill in when the credential type is "CVM Role". It must match the role name bound to the CVM. |
| Language | Plug-in display language |
| Enable private network API Mode | Whether to access cloud API through private network |
| Enable the display type option on the explore page | Enable the display type option on the explore page to control the chart type shown |
-
In the left sidebar, Create Dashboards, Add new panel on the Dashboard webpage
-
Select the newly created CLS datasource in data source selection
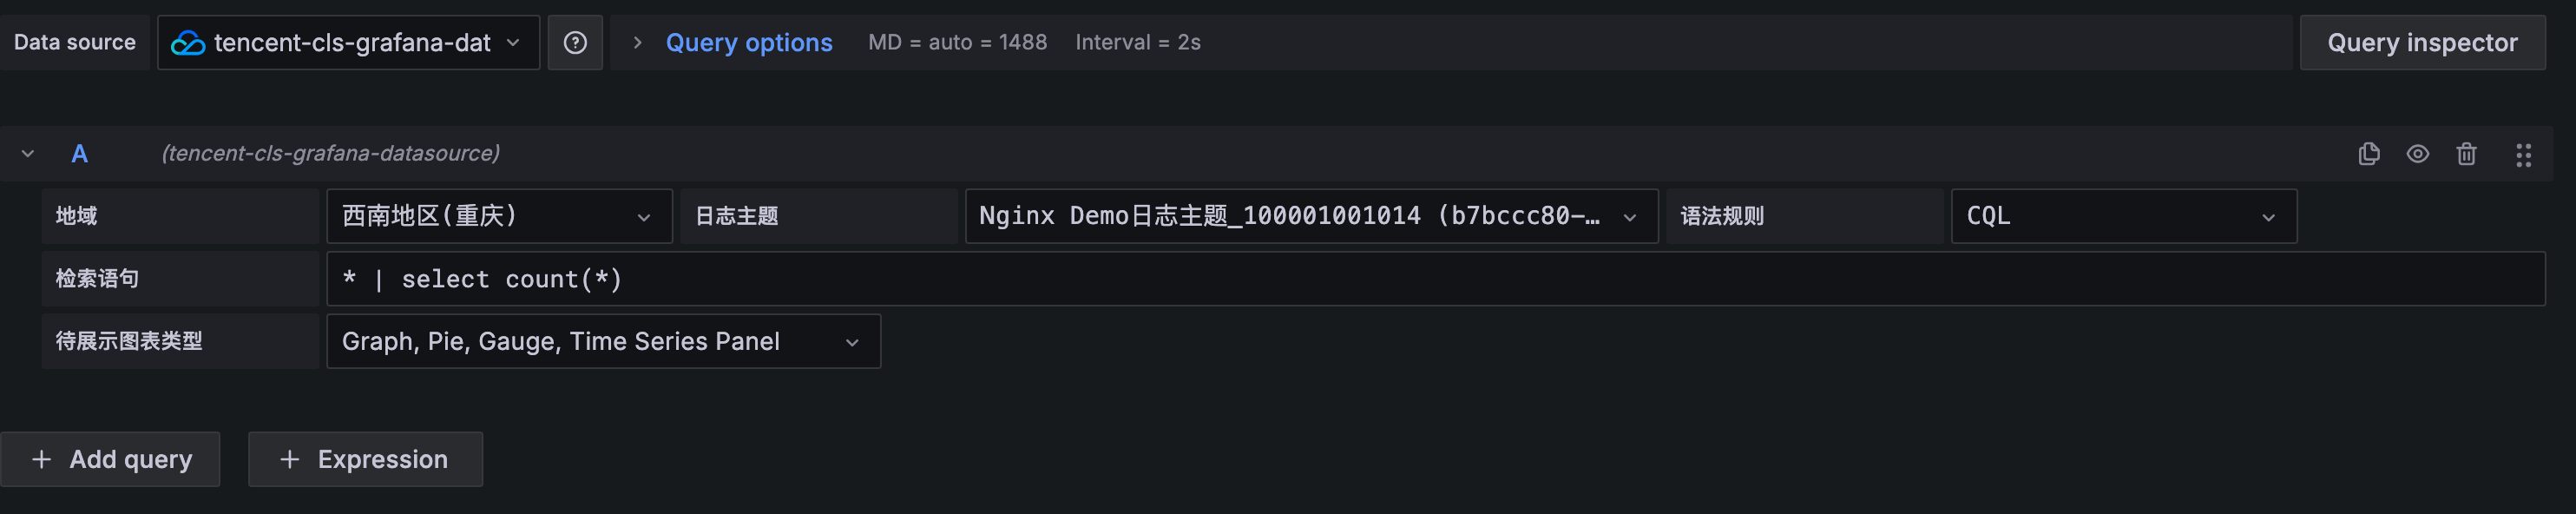
- Enter the Query statement, select the Format based on the chart type to show, and the system will perform data transformation to meet grafana display requirements.
| Format | Description | Configuration Item |
|---|---|---|
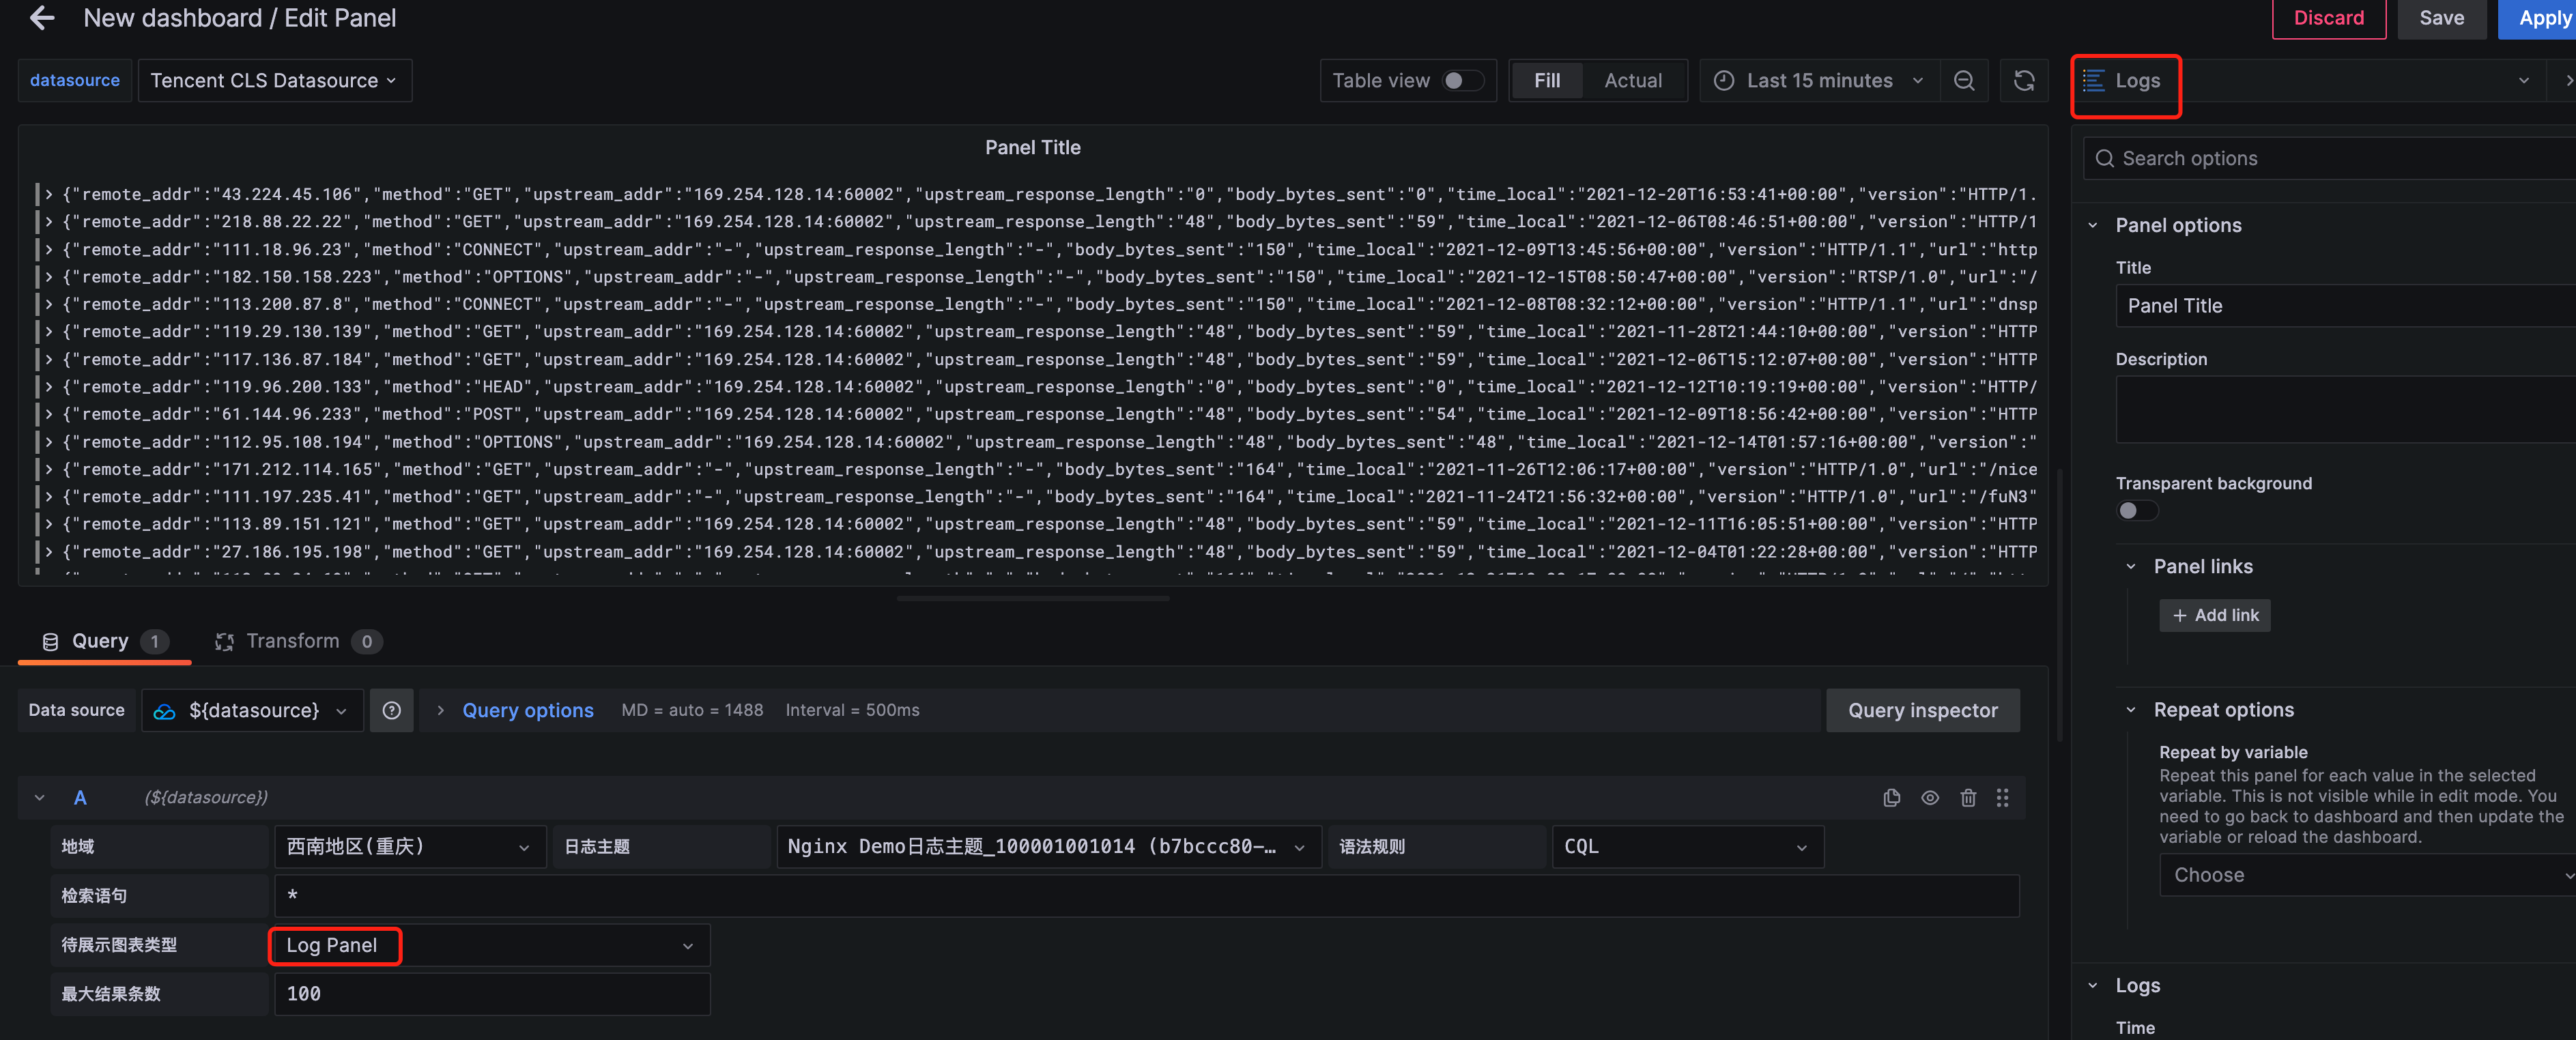
| Log Panel | The Log Panel is used to show Log retrieval results. Query syntax supports searching by keyword and fuzzy match. For more details, see syntax and Rules. Eg. status:400 | limit: used to specify the number of entries returned |
| Table Panel | the Table Panel automatically displays the query results, including all returned columns and rows | None |
| Graph, Pie, Gauge, Time Series Panel | data is transformed to fit Graph, Pie, Gauge, or Time Series Panel | None |
Show pv and uv data curve
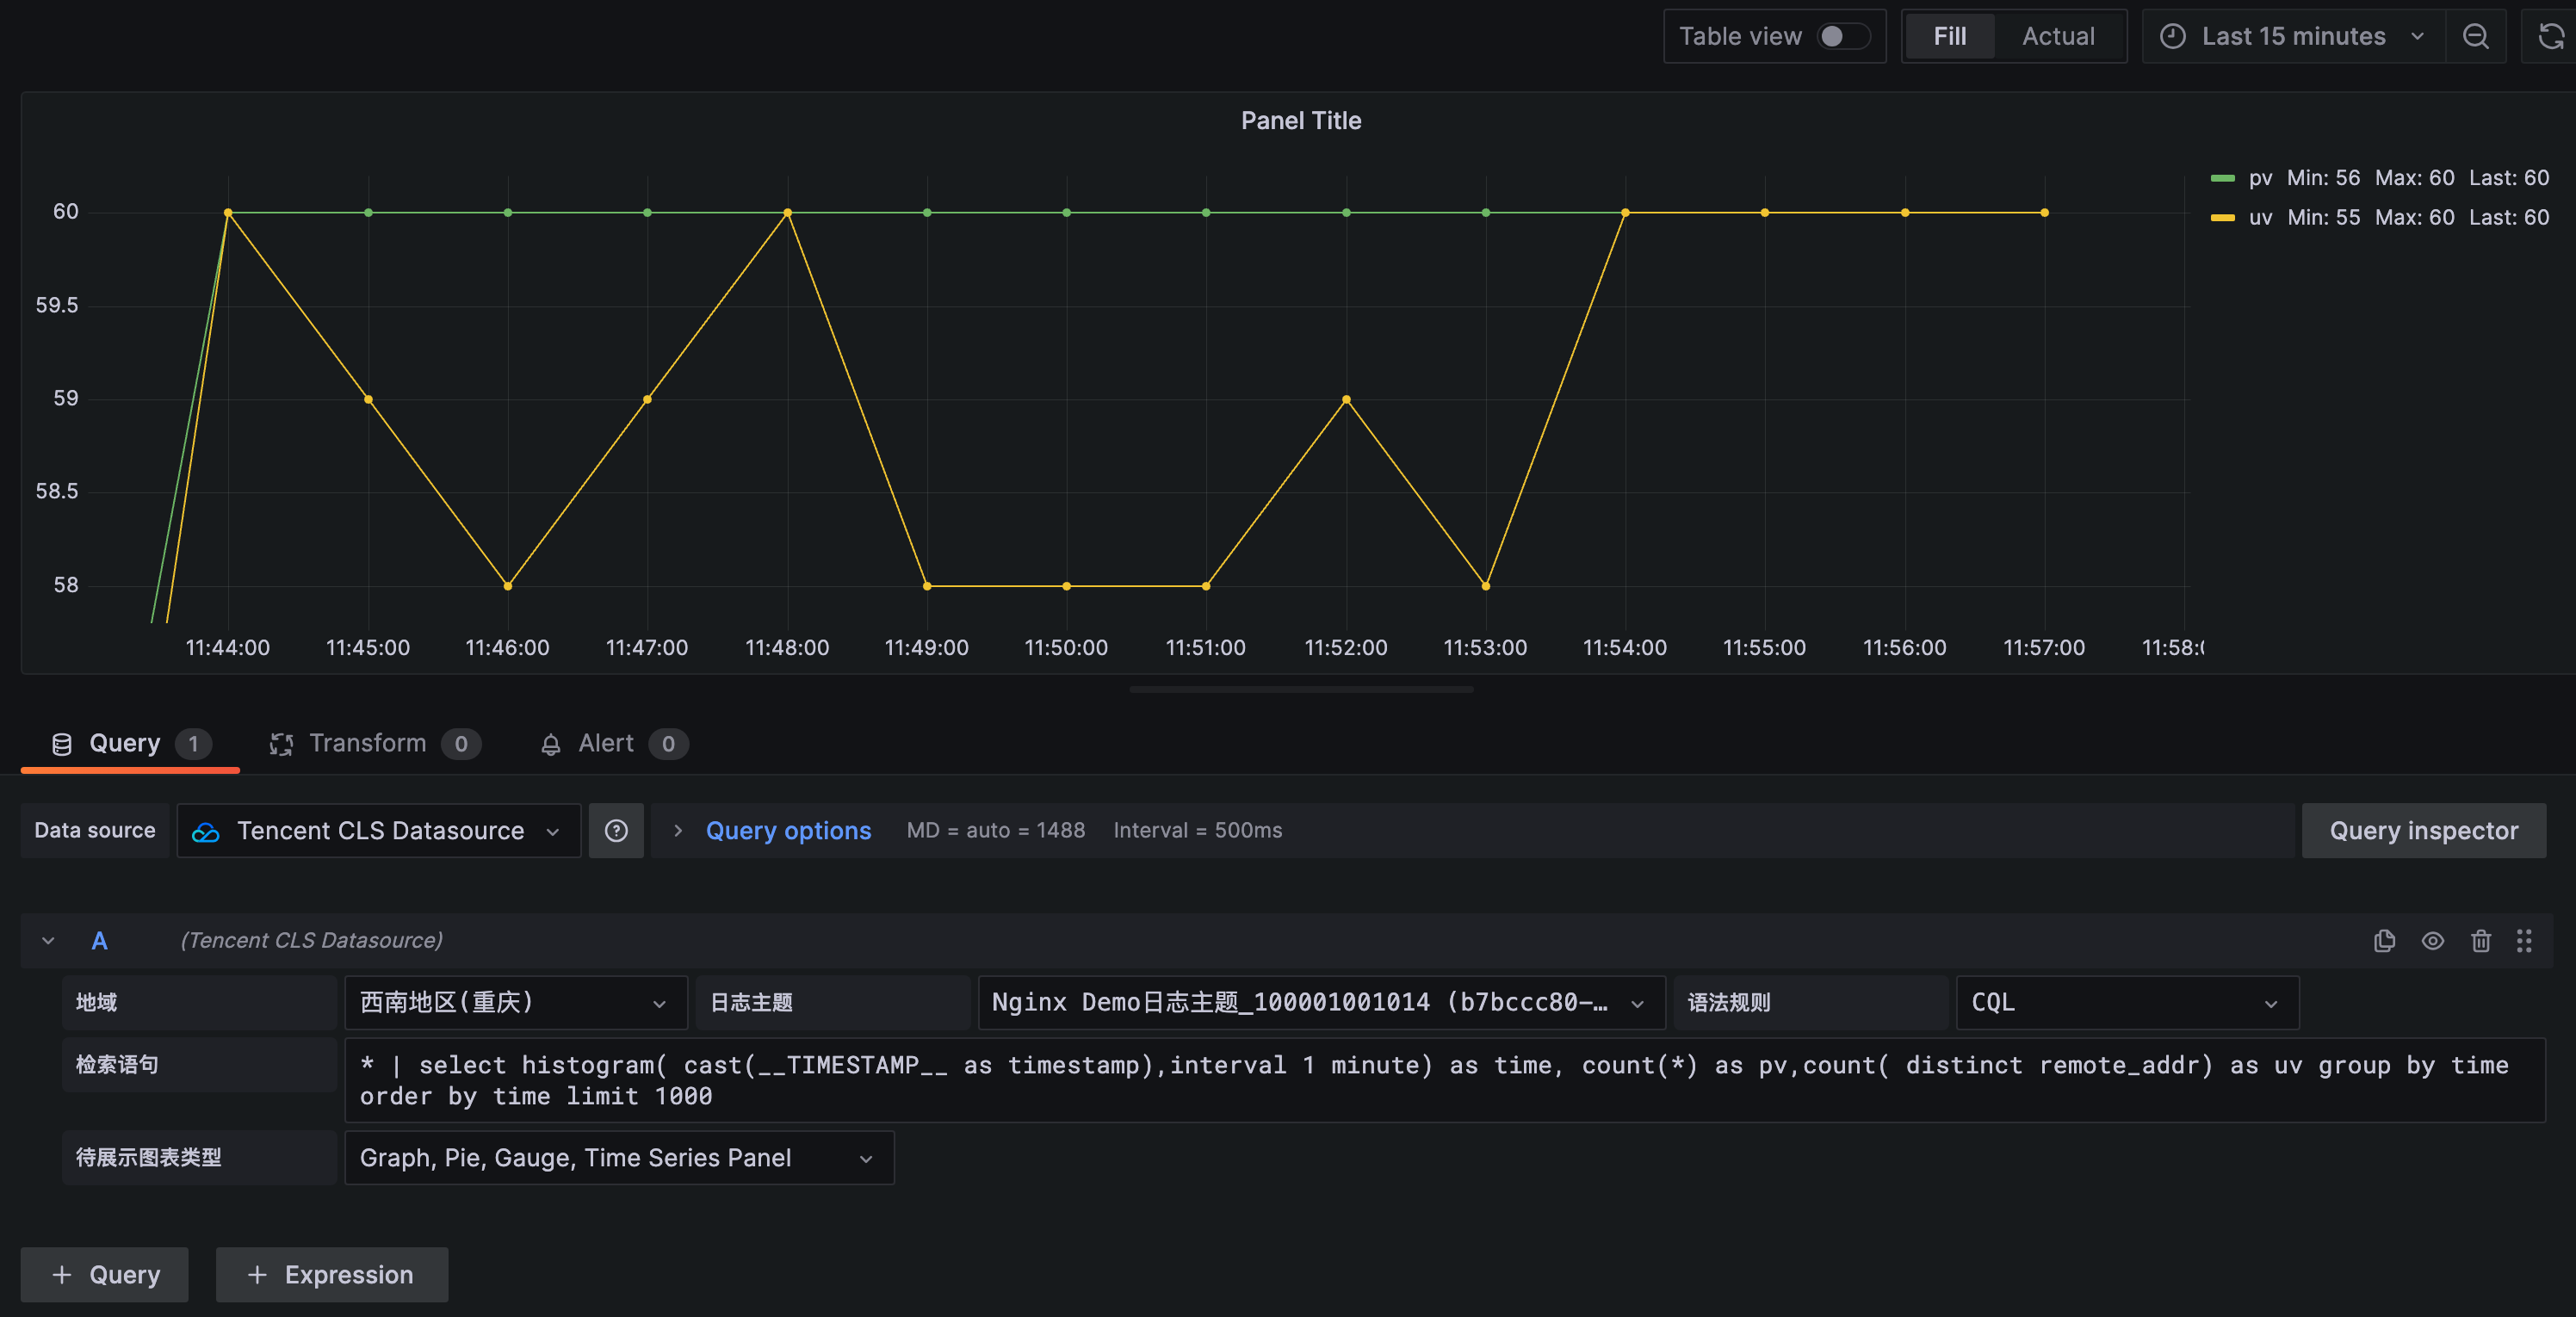
query statement:
* | select histogram( cast(__TIMESTAMP__ as timestamp),interval 1 minute) as time, count(*) as pv,count( distinct remote_addr) as uv group by time order by time limit 1000
Format: Select Graph, Pie, Gauge, Time Series Panel
Show request status code distribution
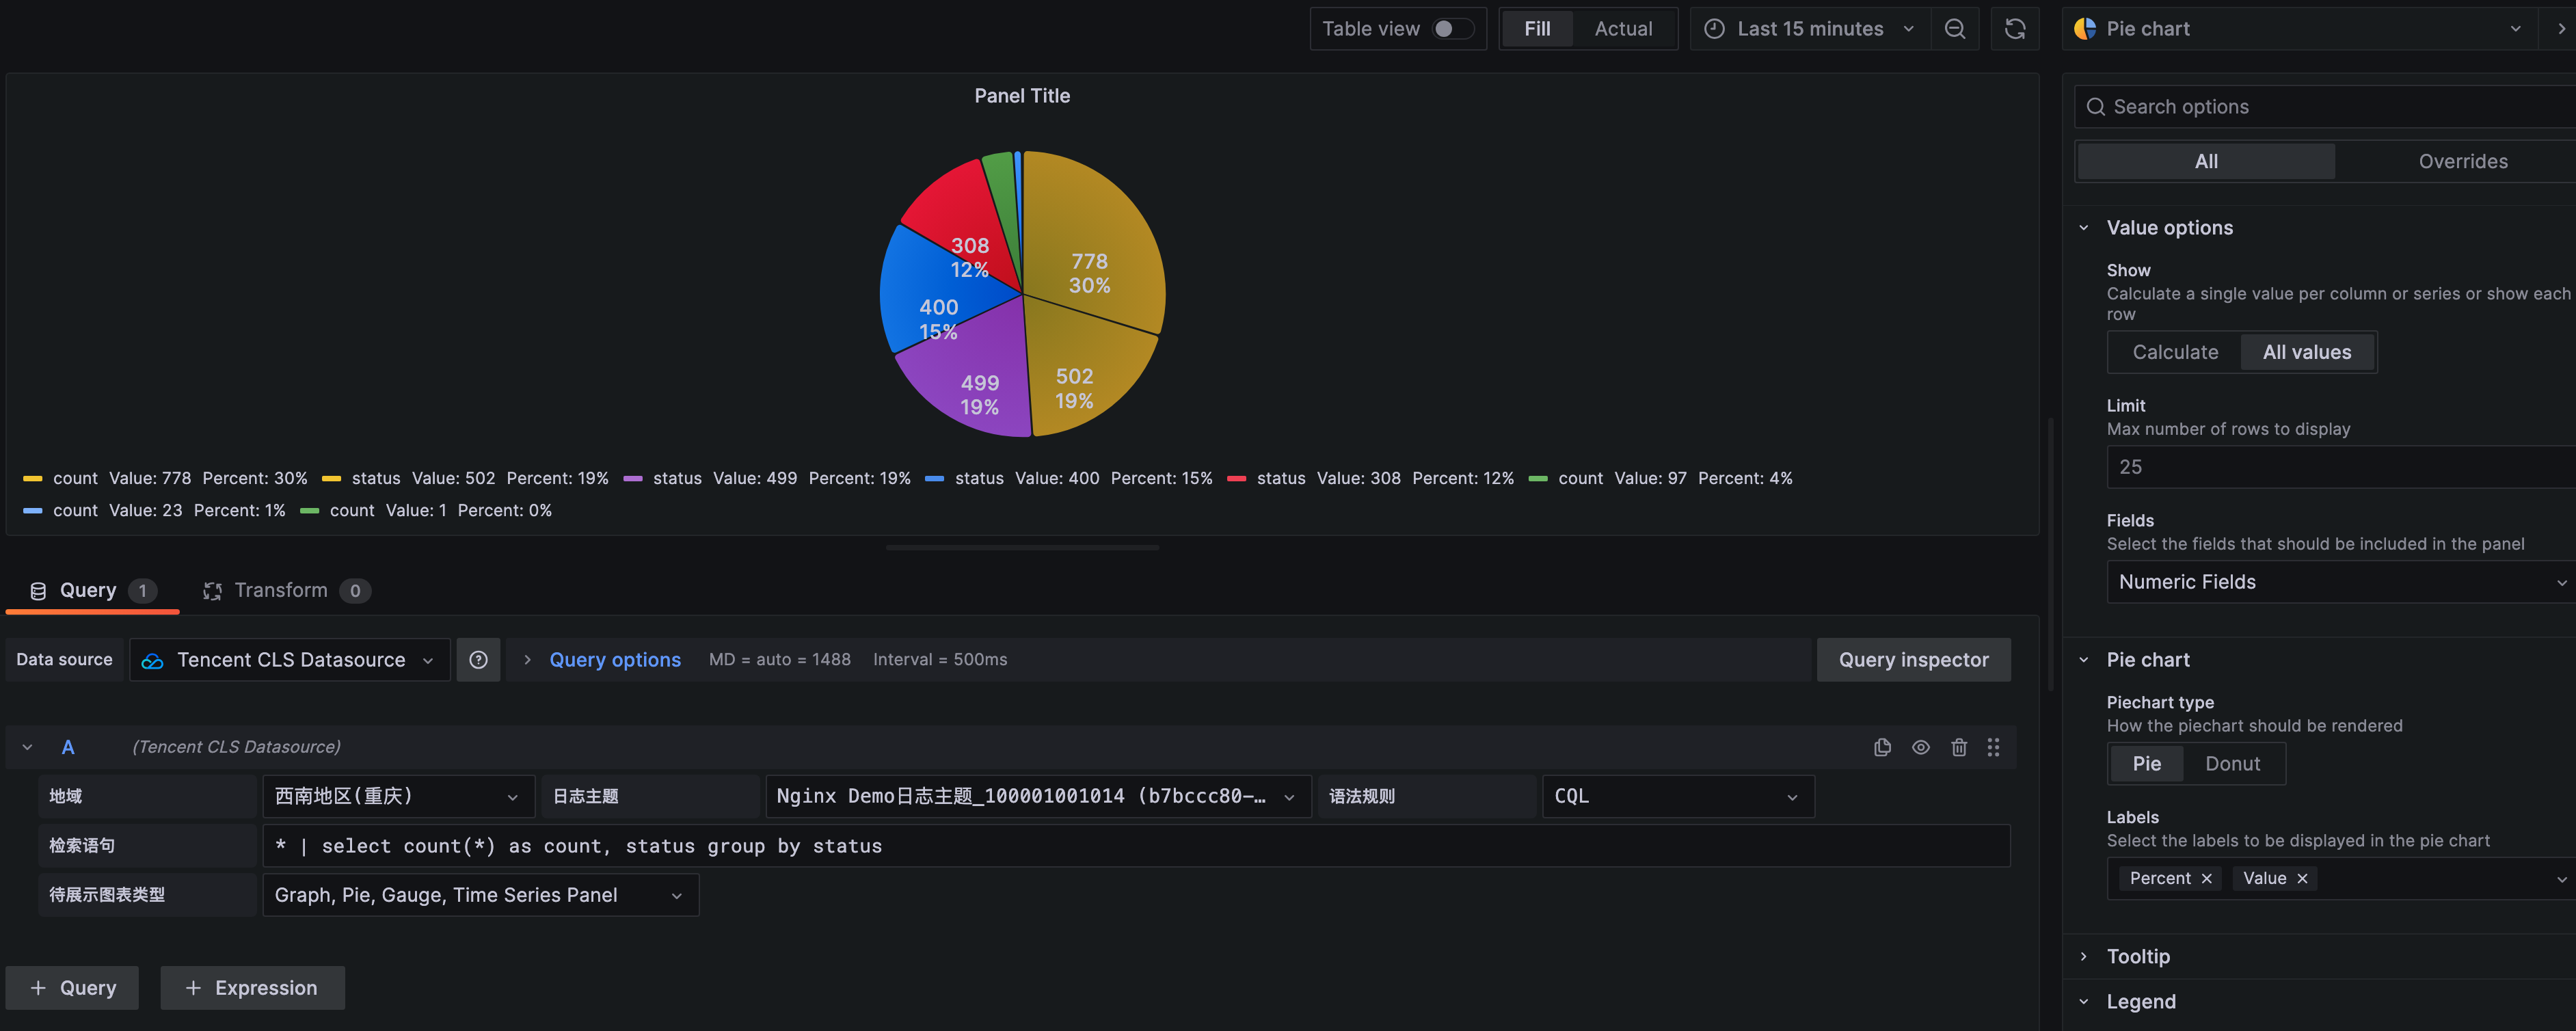
query statement:
* | select count(*) as count, status group by status
Format: Select Graph, Pie, Gauge, Time Series Panel
Statistics of top 10 webpages by access latency
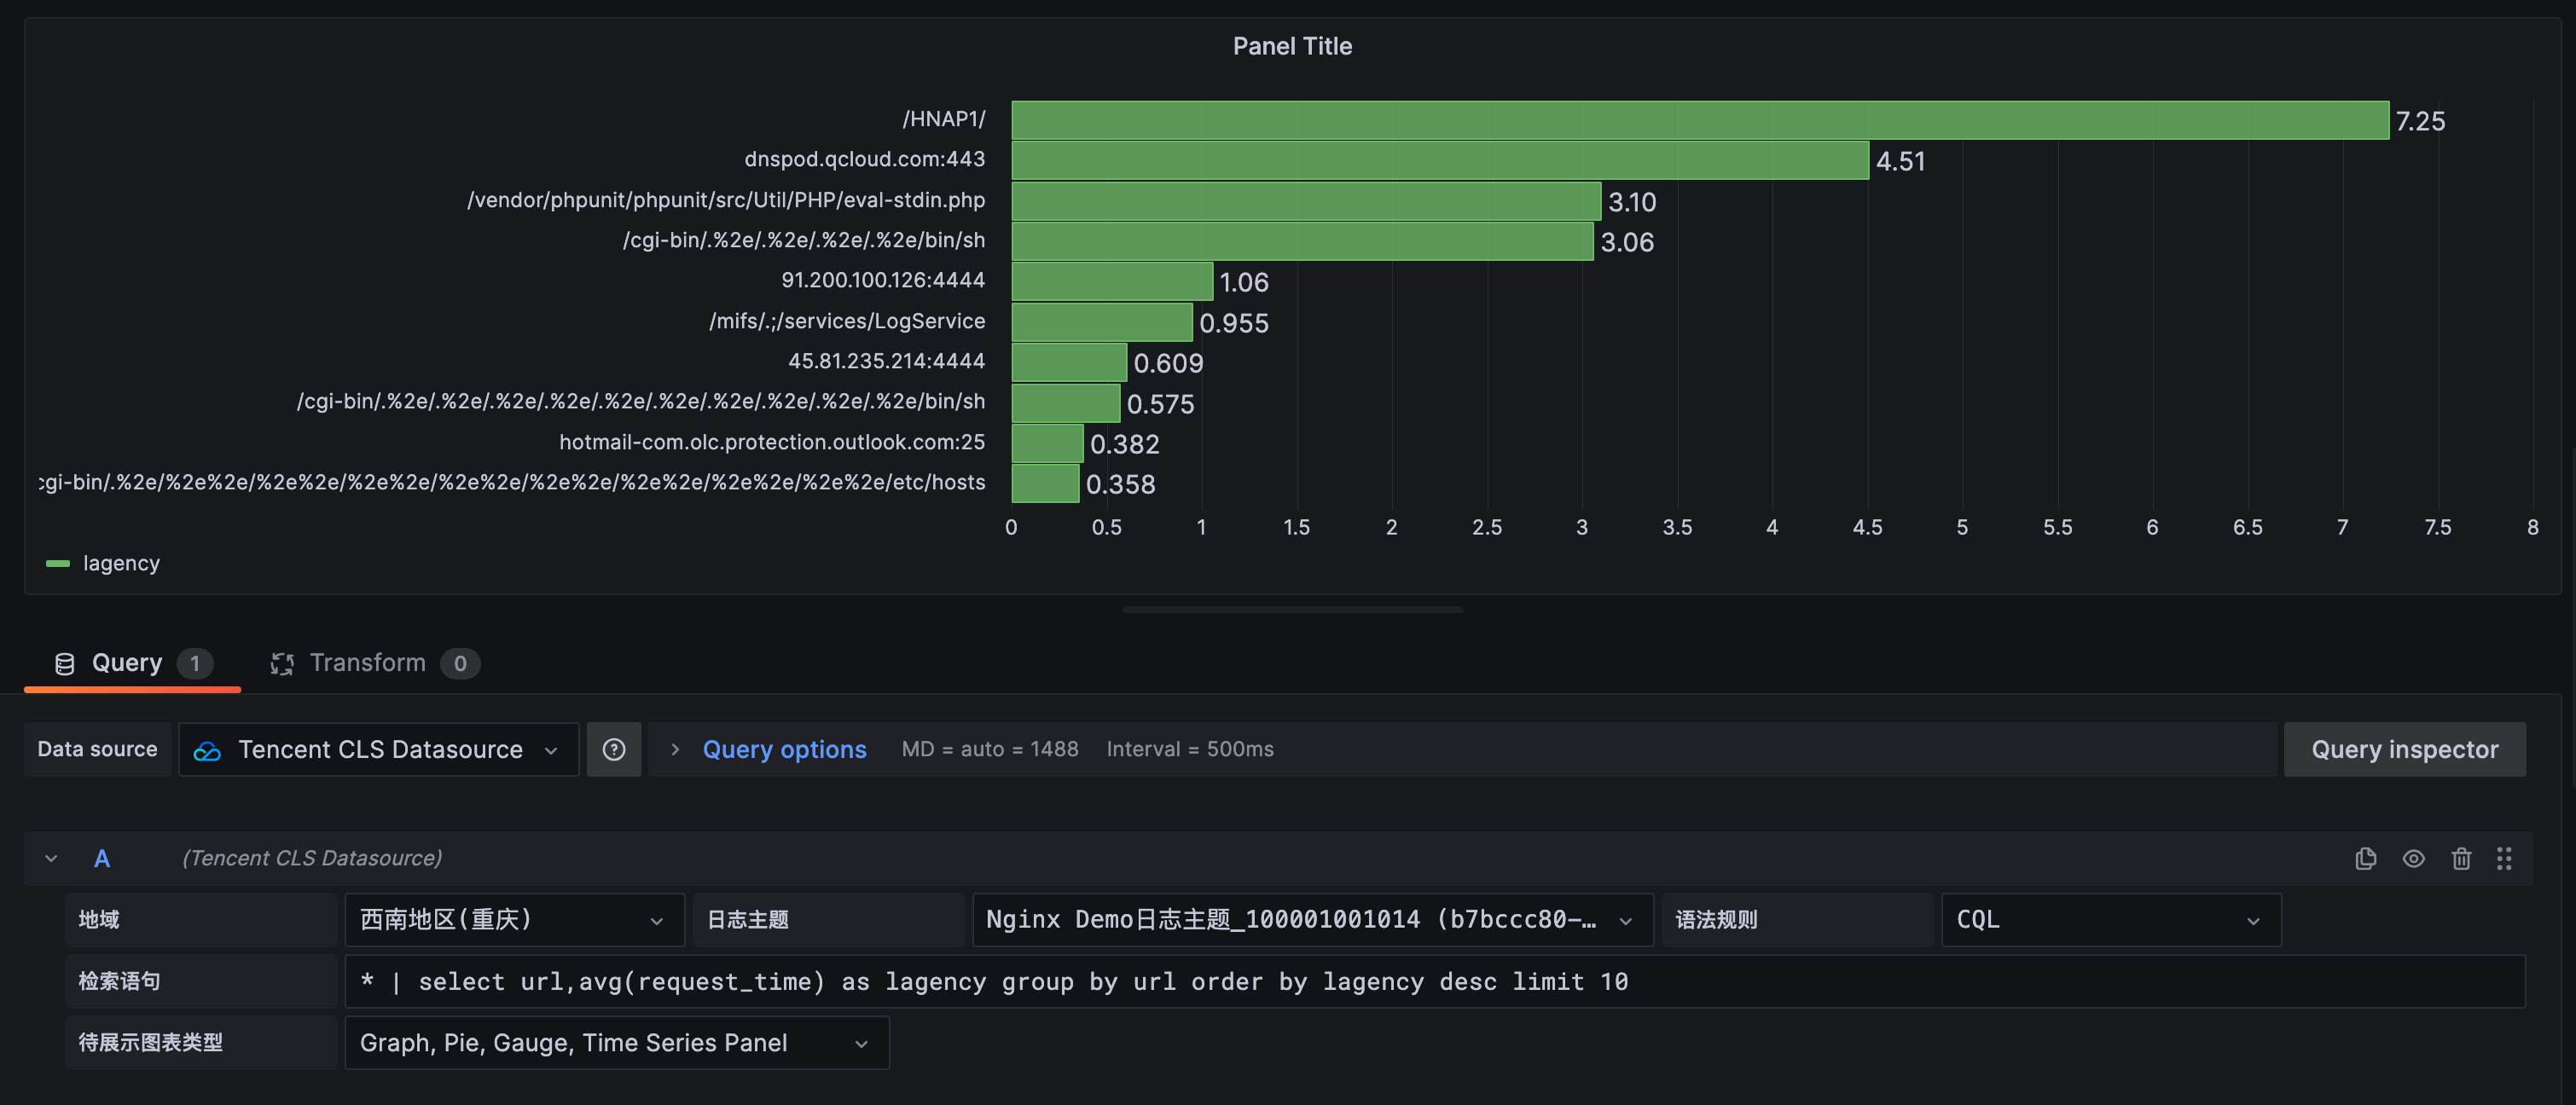
query statement:
* | select url, avg(request_time) as lagency group by url order by lagency desc limit 10
Format: Select Graph, Pie, Gauge, Time Series Panel
Show top 10 users by access traffic
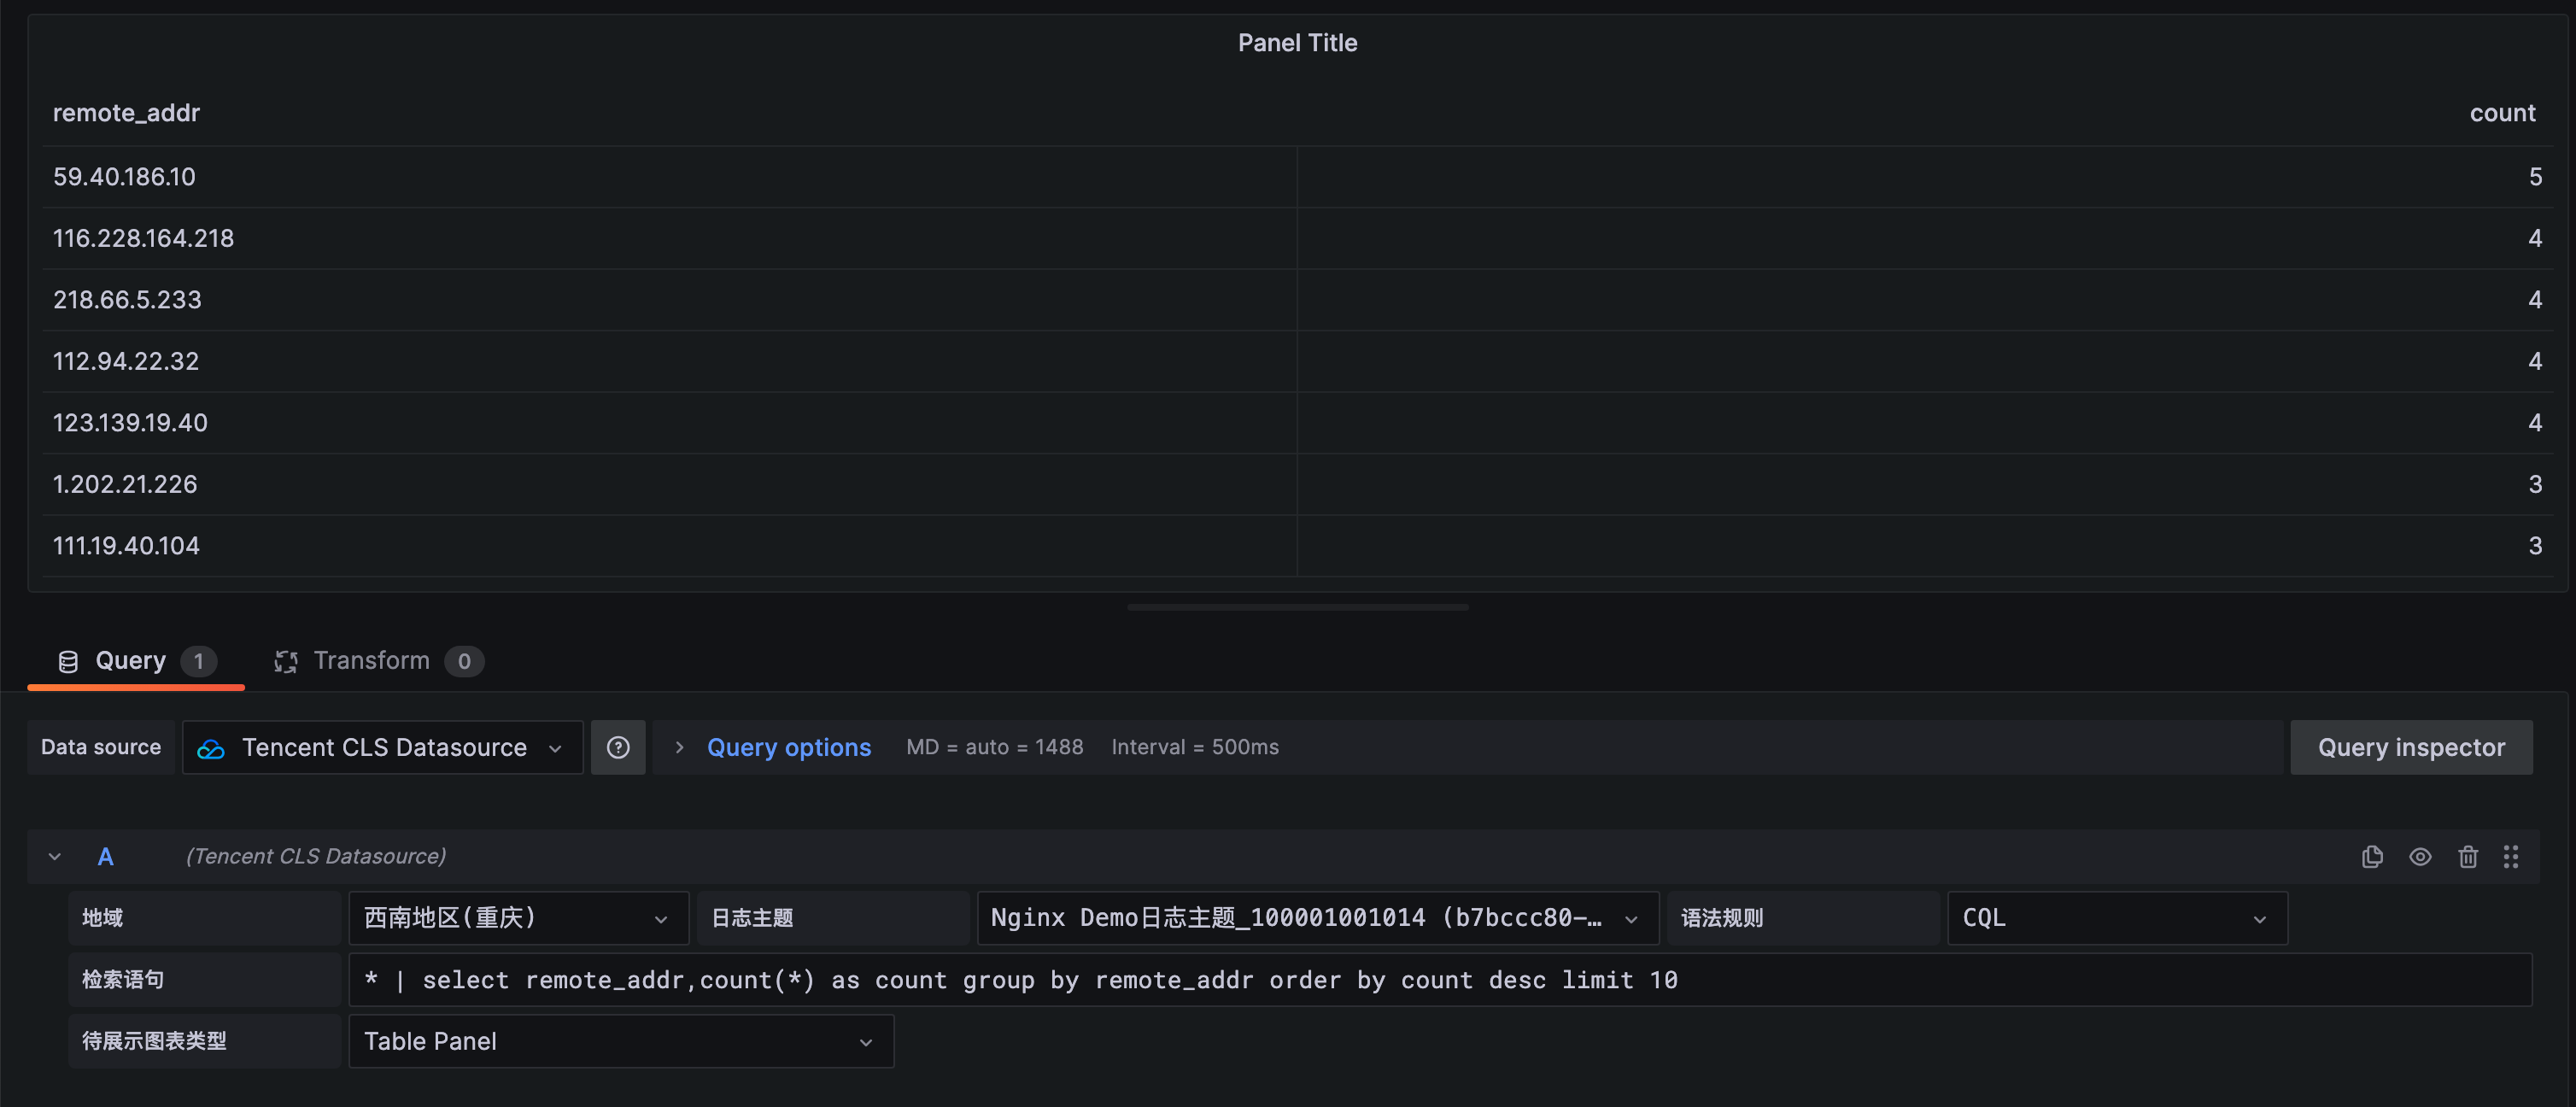
query statement:
* | select remote_addr,count(*) as count group by remote_addr order by count desc limit 10
Format:Table Panel
Show raw log
query statement:
*
Format:Log Panel
Template Variables Templates and variables
The CLS data source plugin supports the use of template variables. Refer to the add variable document to create dashboard variables and use them. Note: Charts that use template variables cannot be used to create Alarms (https://grafana.com/docs/grafana/latest/alerting/create-alerts/#conditions).
Here is a usage example for Custom, Query, and DataSources variable types. Other variable types are basically the same in usage.
Enter the variable name Interval, select type as Custom. In Custom Options, add the variable options separated by commas. For example, enter the following content to get the options shown in figure.
1 MINUTE,5 MINUTE,15 MINUTE,30 MINUTE,1 HOUR,1 DAY

During use, refer to the time line chart in the instance, replace 1 minute with ${Interval} in the Query statement, keep other configuration unchanged, and variables in queries will be replaced with the selected variable value.
* | select histogram( cast(__TIMESTAMP__ as timestamp),interval ${Interval}) as time, count(*) as pv group by time order by time
Enter the variable name HttpStatus, select type as Query. In Query Options, select data source as CLS data source, refresh time available as On Time Range Changed or On Dashboard Load. Enter the following Query statement (modify according to business Topic), enter Regex to filter results, and select Sort to Sort results.
* | select status

When using variables, you can query with the following statement
status:${HttpStatus}
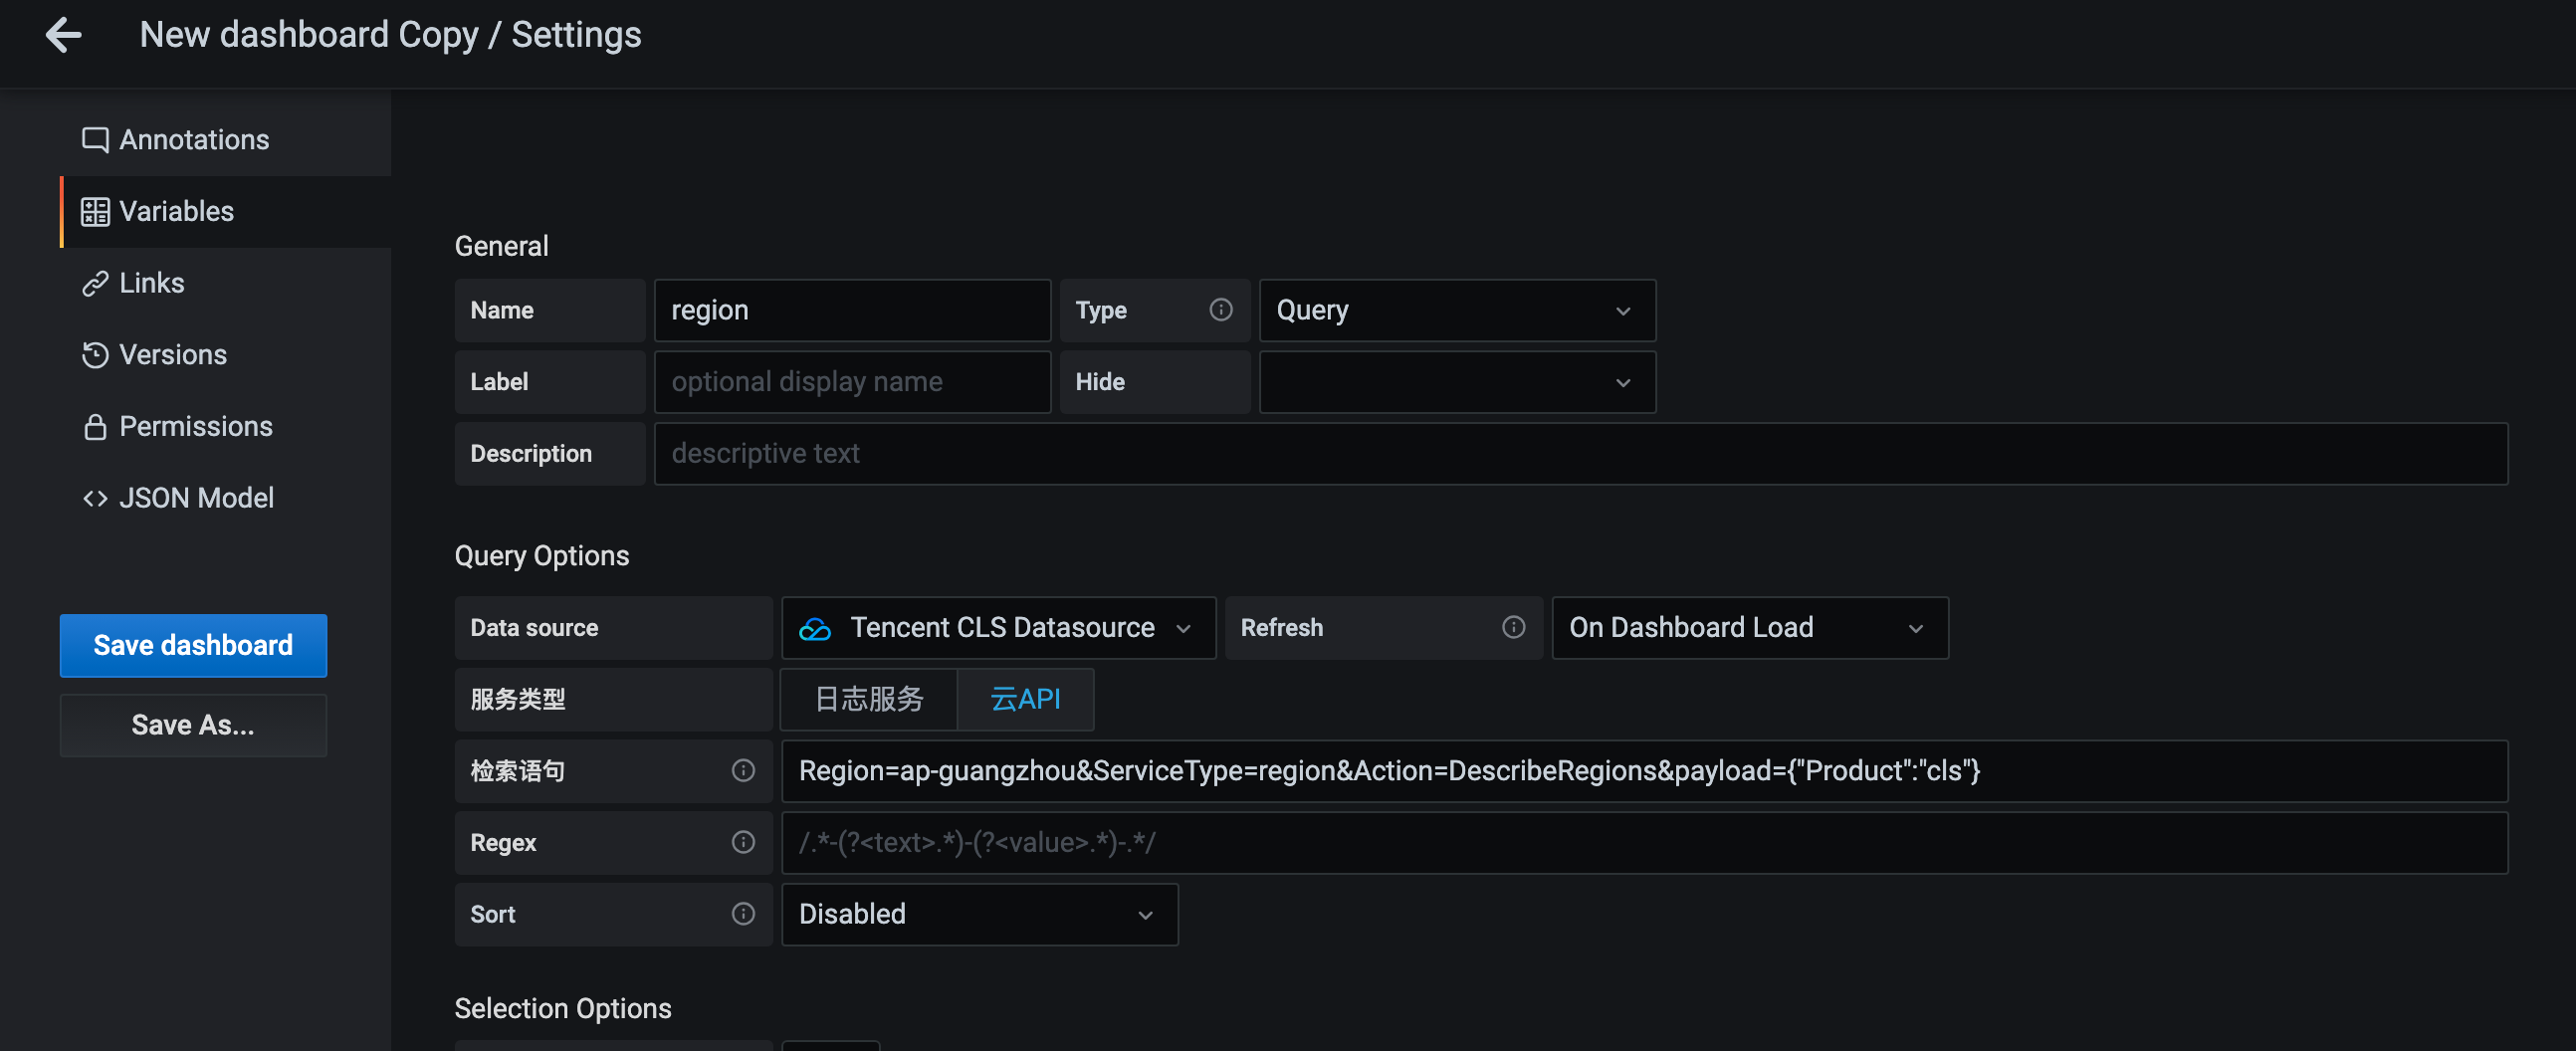
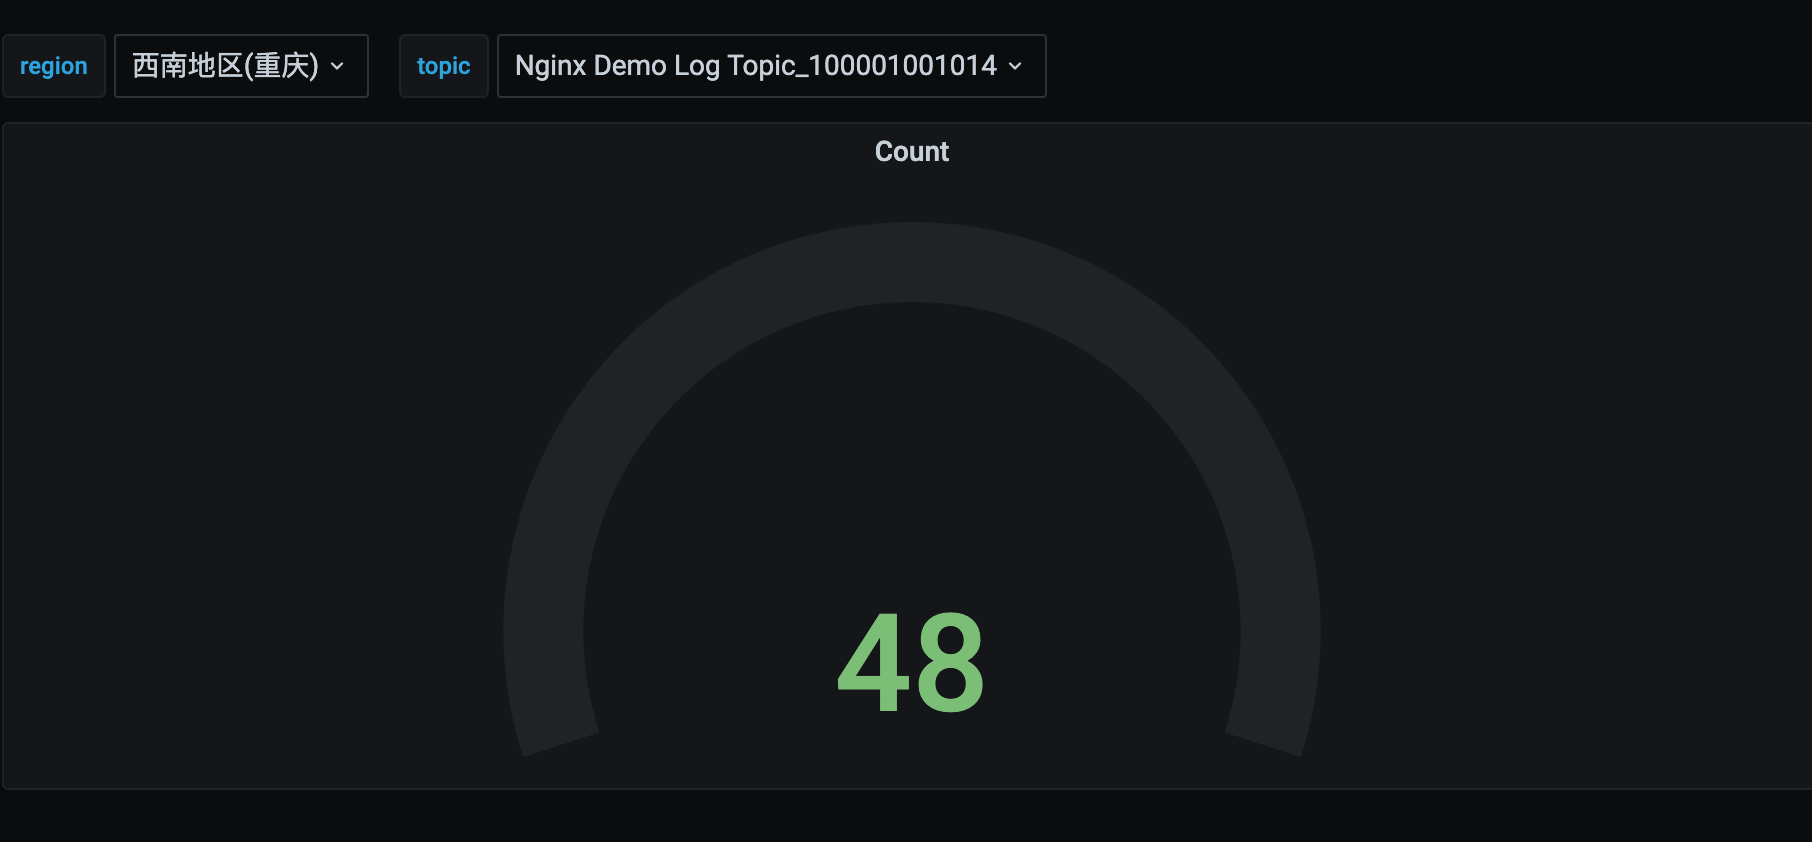
Select "Cloud API" for the service type selection variable. The variable dropdown option supports querying via Cloud API (https://cloud.tencent.com/document/api) API requests. Only list-type interfaces are supported for querying.
For example, configure CLS region variables + log topic variables.
region:
ServiceType=region&Action=DescribeRegions&payload={"Product":"cls"}
topic (all)
Region=${region}&ServiceType=cls&Action=DescribeTopics&field=Topics&id=TopicId&name=TopicName
topic (filter by TopicName):
Region=${region}&ServiceType=cls&Action=DescribeTopics&field=Topics&id=TopicId&name=TopicName&payload={"Filters":[{"Key":"topicName","Values":["your topic name"]}]}
Statement parameter description:
Region (optional): Tencent Cloud region, default ap-guangzhou
ServiceType (required): Cloud API service name/product name, such as cls
Action (required): Cloud API Interface name, such as DescribeTopics
field (DescribeRegions API not required, other required): list returned array field name, such as Topics
id (not required for DescribeRegions API, other fields required): list returned with the field name of ID in the instance, such as TopicId
name (DescribeRegions API not required, other required): list returned instance name field name in the instance, such as TopicName
payload (optional): Other parameters that require the input of the cloud API, in JSON String Format. For example {"Filters":[{"Key":"topicName","Values":["your topic name"]}]}
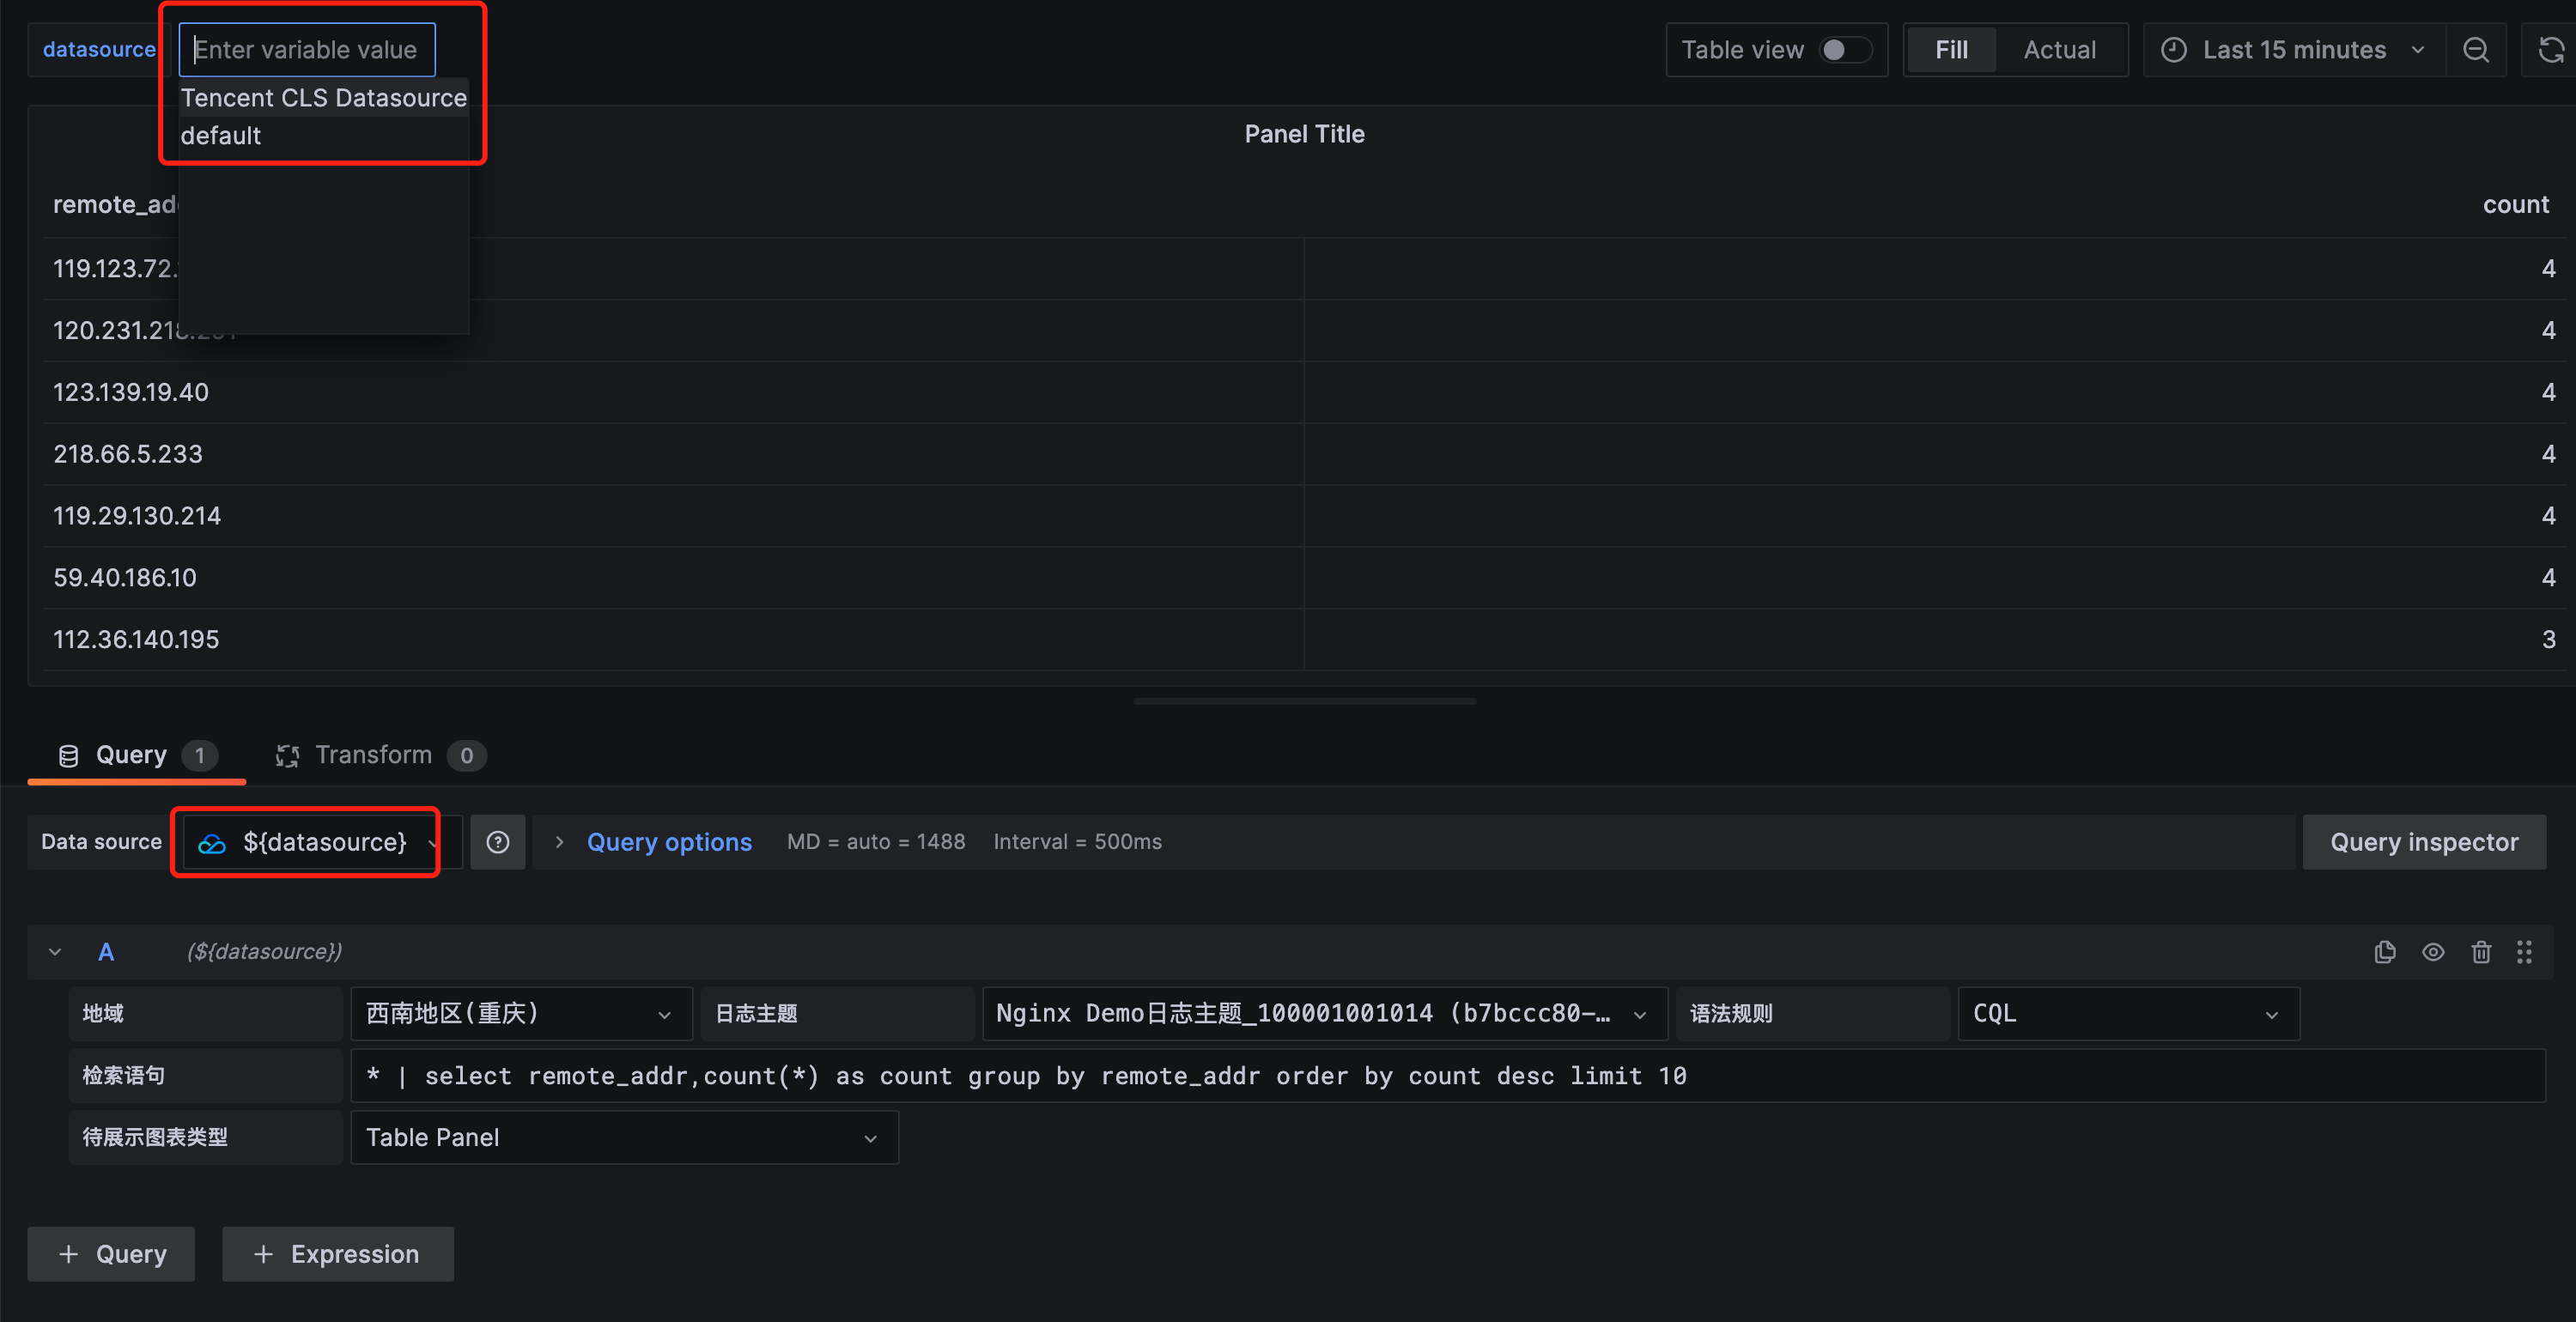
Enter the variable name Datasource, select the variable type as Datasource, and set Type to Tencent CLS Datasource in Data source options. Preview effect usage as follows
Note: Datasource Type variable is applicable only to the case where multiple indexes of CLS data sources with same configuration (or similar) exist in Grafana.
- macOS system log path: /usr/local/var/log/grafana/grafana.log
- Linux system log path: /var/log/grafana/grafana.log
- Troubleshoot: https://grafana.com/docs/grafana/latest/troubleshooting/
- Tencent Cloud log service official website document: https://cloud.tencent.com/document/product/614/52102