
日志服务CLS与Grafana打通,支持将CLS的原始日志数据与SQL聚合分析结果导出至Grafana展示。用户只需安装CLS日志服务grafana插件,在grafana填写检索分析的语句,即可在Grafana上展示结果。
注意: 插件自 1.0.3 版本起,已使用腾讯云日志服务新检索接口,查询日志更稳定更快捷。
1.0.2 及以下版本查询原始日志(Logs)时, 存在检索异常,请用户尽快主动升级到最新版本。
安装 Grafana 7以上版本,具体操作请参见Grafana安装文档 。对于低版本Grafana,请参考Grafana升级指南 。
以 RPM-based Linux 为例,可使用 源安装 (推荐) 与 手动安装 方式
sudo systemctl daemon-reload
sudo systemctl start grafana-server
sudo systemctl status grafana-server
sudo systemctl enable grafana-server
若需要安装更多可视化图表,如饼图,趋势速览图,需执行命令安装grafana的panel插件,如安装饼图pie panel。
grafana-cli plugins install grafana-piechart-panel
service grafana-server restart
更多插件安装请参考Grafana plugins
对于不同的 Grafana 安装方式,需要通过以下不同方式安装 CLS 数据源插件。
-
请确认Grafana的插件目录位置。在Centos的插件目录/var/lib/grafana/plugins/安装插件,重启grafana-server。
cd /var/lib/grafana/plugins/
timeout 60s wget --timeout=10 --tries=1 -O tencent-cls-grafana-datasource.zip https://github.com/TencentCloud/cls-grafana-datasource/releases/latest/download/tencent-cls-grafana-datasource.zip || wget -O tencent-cls-grafana-datasource.zip https://cnb.cool/tencent/cloud/cls/frontend/cls-grafana-datasource/-/releases/latest/download/tencent-cls-grafana-datasource.zip
unzip tencent-cls-grafana-datasource
或使用一键安装脚本(末尾参数为插件安装目录)
/bin/bash -c "$(curl -fsL --max-time 10 https://raw.githubusercontent.com/TencentCloud/cls-grafana-datasource/master/toolkit/update.sh || curl -fsSL https://cnb.cool/tencent/cloud/cls/frontend/cls-grafana-datasource/-/git/raw/main/toolkit/update_from_cnb.sh)" bash /var/lib/grafana/plugins/ -
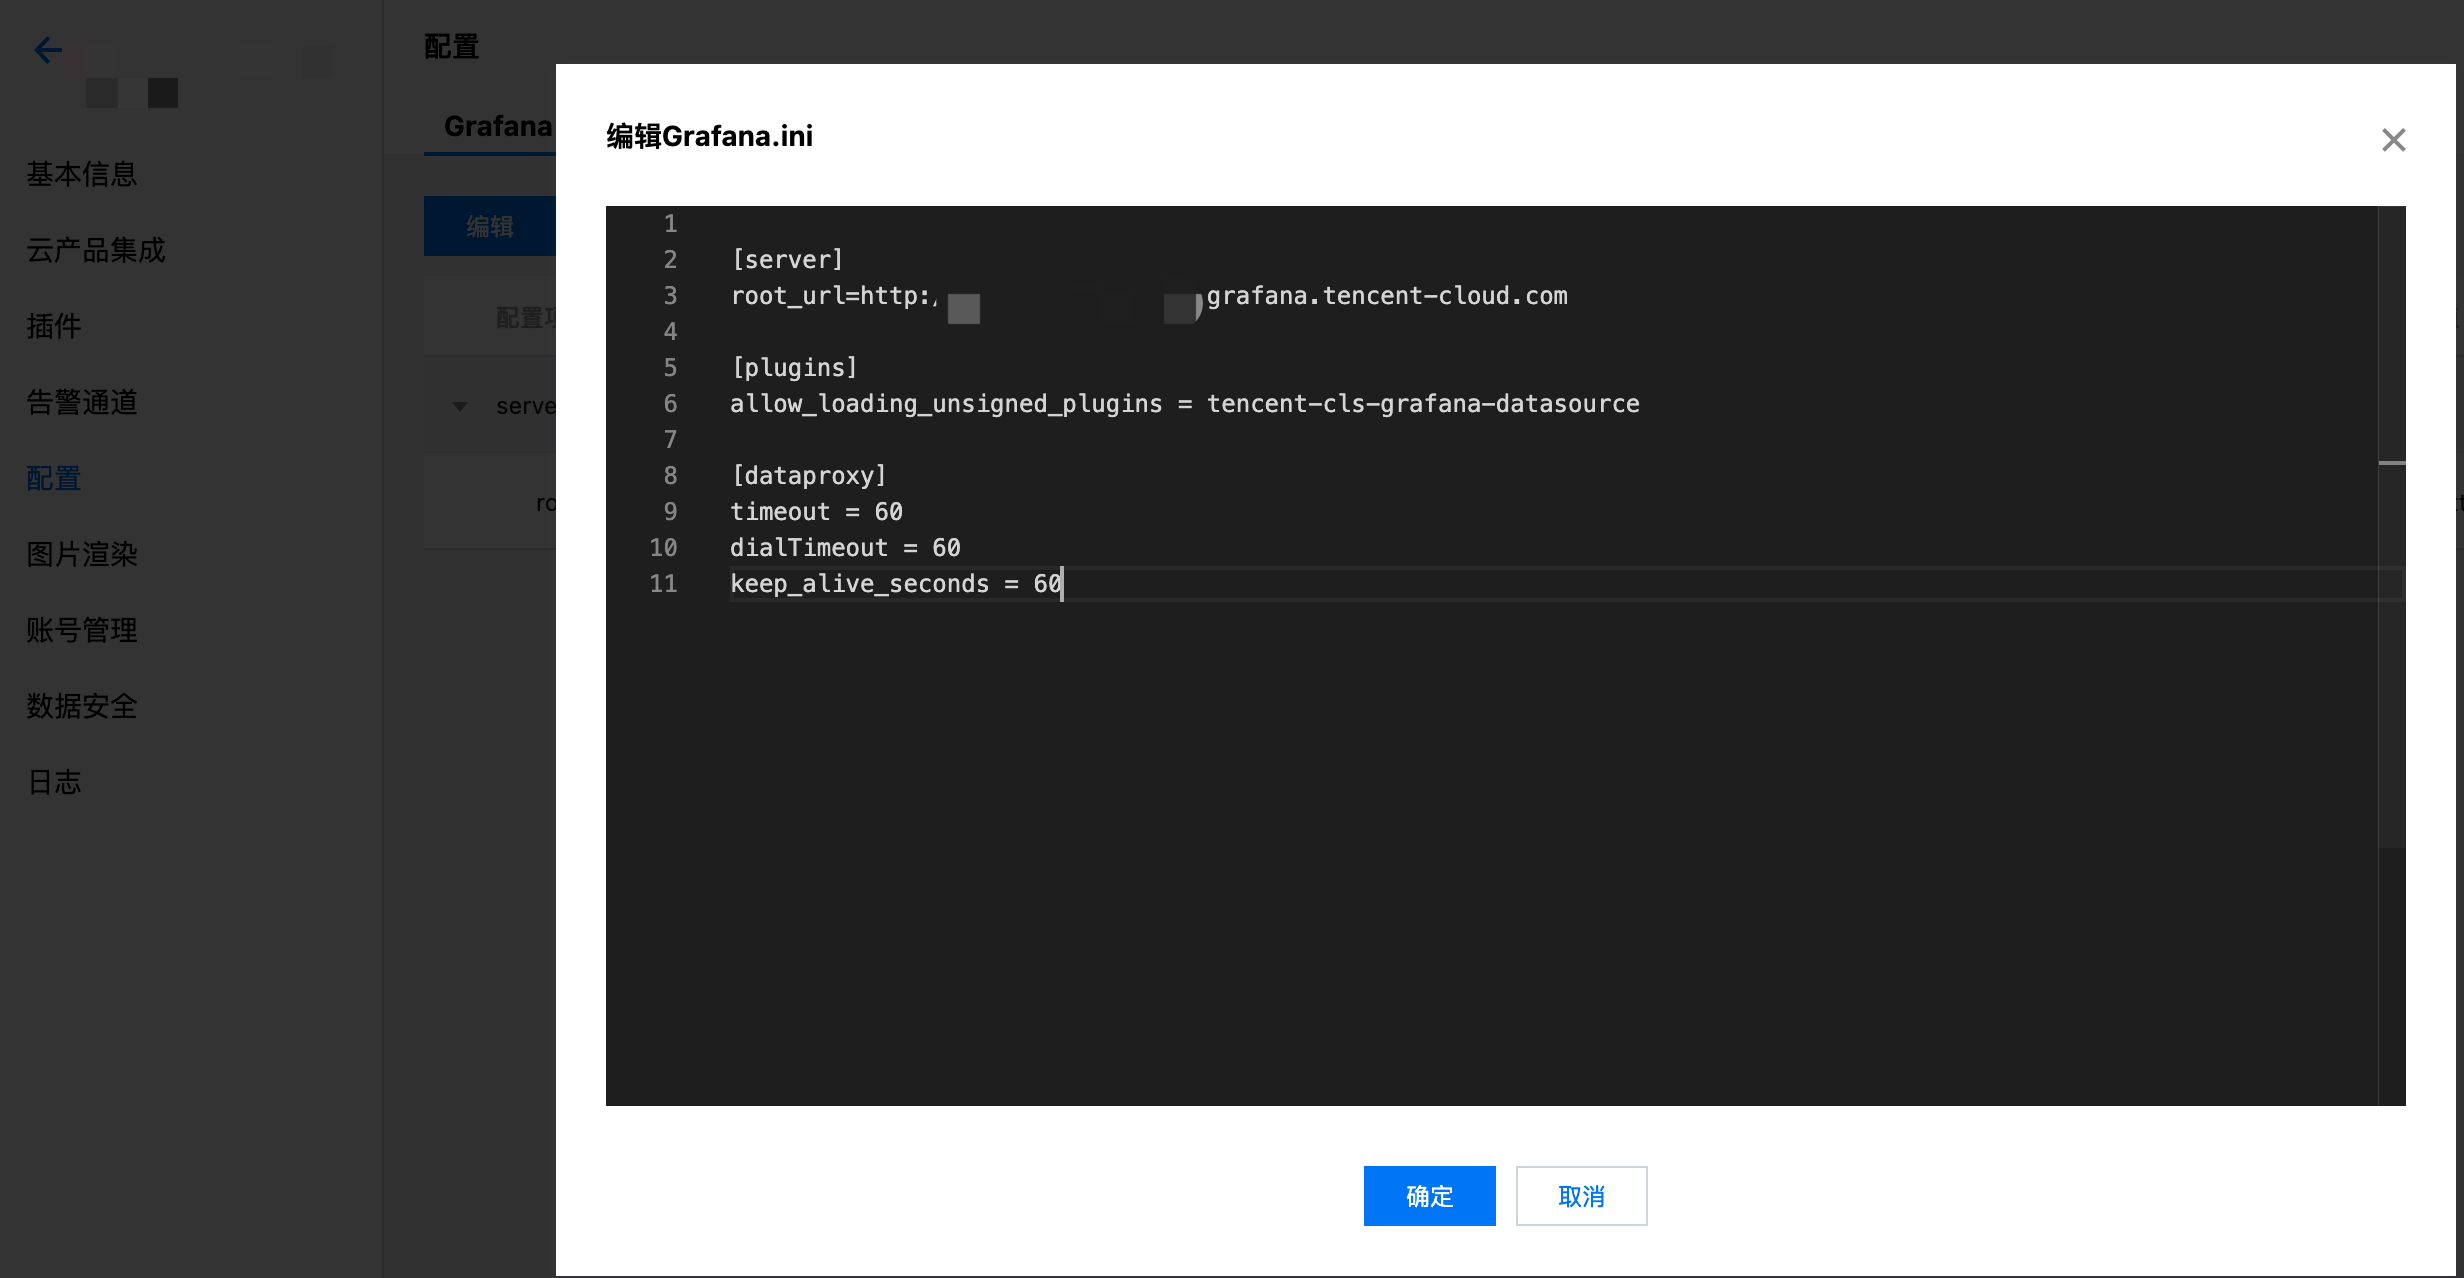
修改Grafana配置文件,配置CLS数据源ID。配置文件路径参考配置文档
-
- 在plugins中设置allow_loading_unsigned_plugins参数
[plugins]
allow_loading_unsigned_plugins = tencent-cls-grafana-datasource
-
- 在dataproxy中设置timeout, dialTimeout, keep_alive_seconds参数
[dataproxy]
timeout = 60
dialTimeout = 60
keep_alive_seconds = 60
- 重启grafana服务
service grafana-server restart
参考Docker中安装Grafana插件指引,通过以下环境变量安装CLS插件。
docker run命令:
docker run -d -p 3000:3000 --name=grafana \
  -e "GF_INSTALL_PLUGINS=https://github.com/TencentCloud/cls-grafana-datasource/releases/latest/download/tencent-cls-grafana-datasource.zip;tencent-cls-grafana-datasource" \
  -e "GF_PLUGINS_ALLOW_LOADING_UNSIGNED_PLUGINS=tencent-cls-grafana-datasource" \
  -e "GF_DATAPROXY_TIMEOUT=60" \
  -e "GF_DATAPROXY_DIALTIMEOUT=60" \
  -e "GF_DATAPROXY_KEEP_ALIVE_SECONDS=60" \
  grafana/grafana
docker compose:
version: '3'

services:
  grafana:
    image: grafana/grafana:latest
    container_name: grafana
    ports:
      - '3000:3000'
    environment:
      - GF_INSTALL_PLUGINS=https://github.com/TencentCloud/cls-grafana-datasource/releases/latest/download/tencent-cls-grafana-datasource.zip;tencent-cls-grafana-datasource
      - GF_PLUGINS_ALLOW_LOADING_UNSIGNED_PLUGINS=tencent-cls-grafana-datasource
      - GF_DATAPROXY_TIMEOUT=60
      - GF_DATAPROXY_DIALTIMEOUT=60
      - GF_DATAPROXY_KEEP_ALIVE_SECONDS=60
- 如果在腾讯云CVM中访问docker源较慢,可参考 在云服务器上使用腾讯云 Docker 软件源 加速。
- 如果访问github较慢,可把
GF_INSTALL_PLUGINS环境变量替换为GF_INSTALL_PLUGINS=https://cnb.cool/tencent/cloud/cls/frontend/cls-grafana-datasource/-/releases/latest/download/tencent-cls-grafana-datasource.zip;tencent-cls-grafana-datasource
- 参考配置管理,配置在Grafana配置中增加以下配置
[plugins]
allow_loading_unsigned_plugins = tencent-cls-grafana-datasource

[dataproxy]
timeout = 60
dialTimeout = 60
keep_alive_seconds = 60
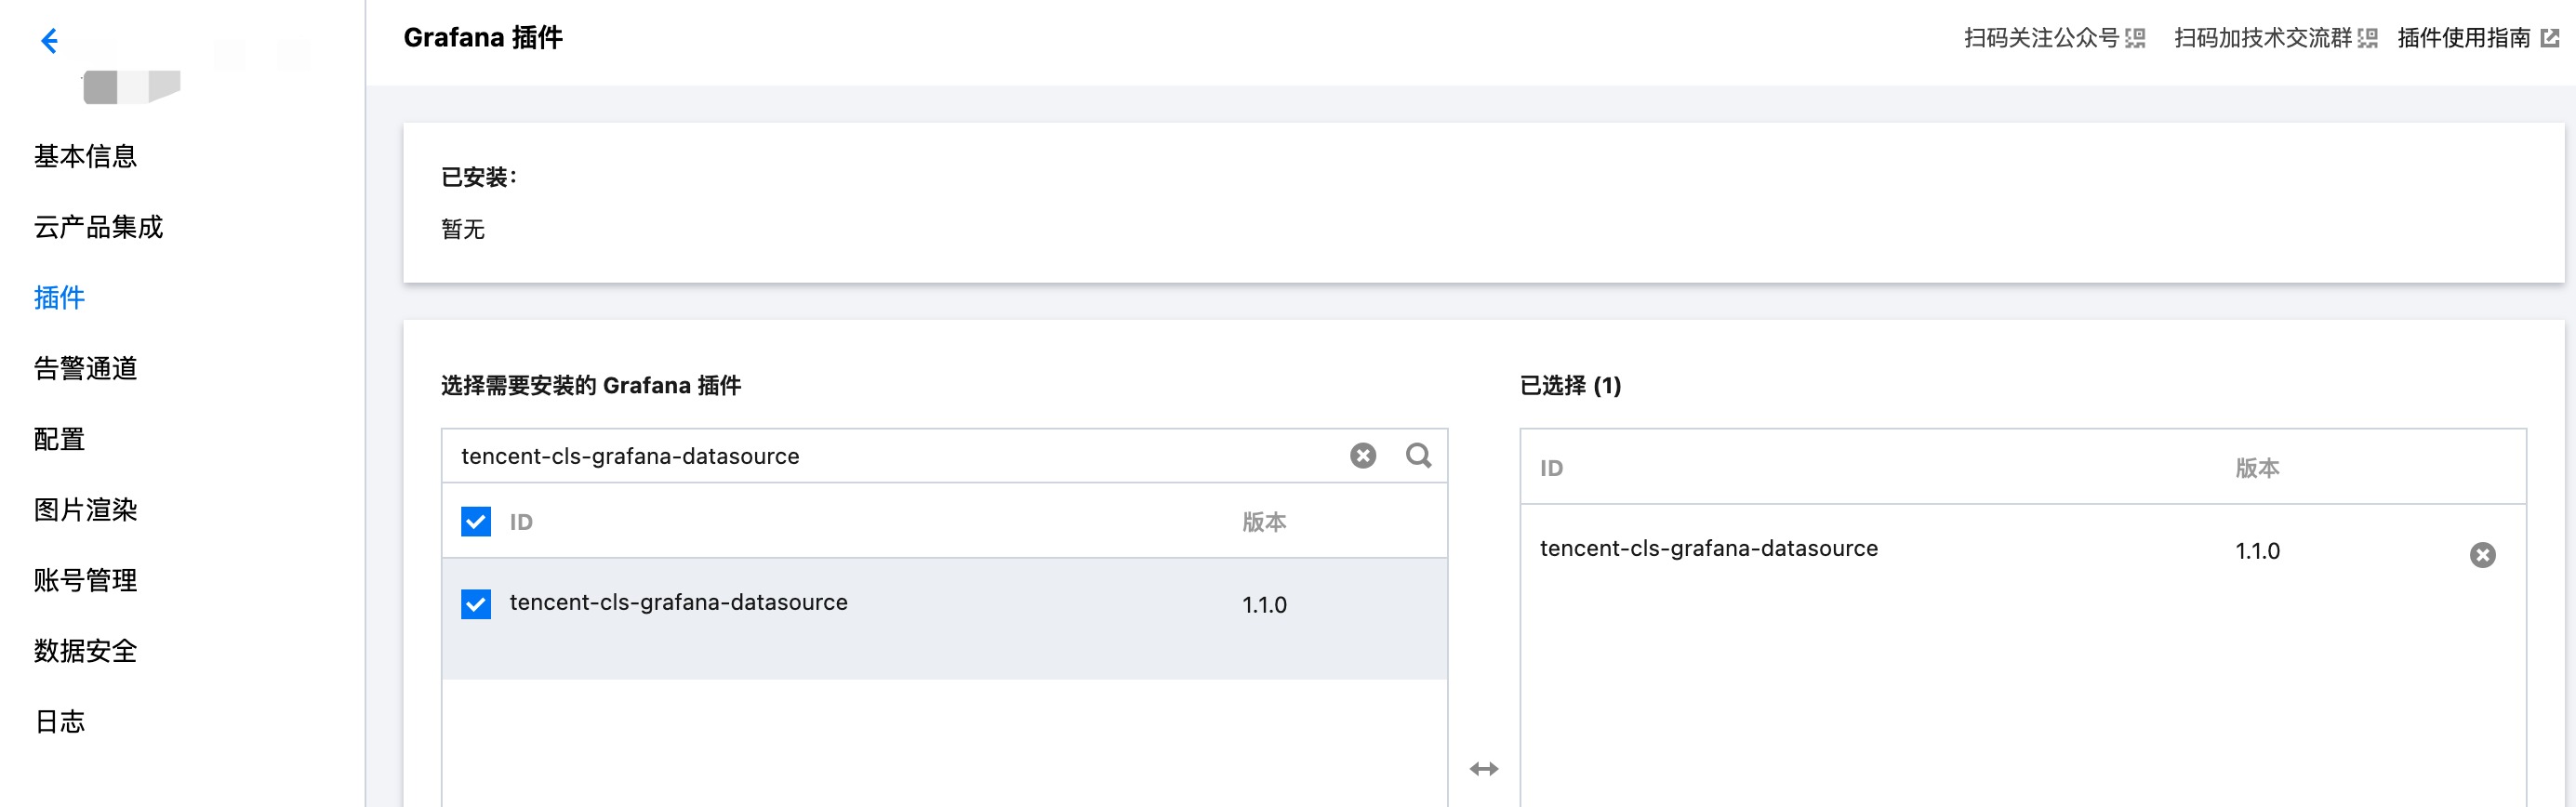
- 参考安装插件,选择安装 tencent-cls-grafana-datasource。
-
登陆Grafana
若您是本机部署,默认是安装在3000端口。请提前在浏览器打开3000端口
-
左侧菜单栏点击设置图标,进入Data Sources
在Data Sources页,单击Add data source,选中Tencent Cloud Log Service Datasource,按照以下说明配置数据源。
配置项 说明 凭证类型 “永久密钥”:通过填入的SecretId, SecretKey发起请求;
“Assume Role”:通过扮演角色身份获取临时密钥发起请求;
“CVM Role”:通过扮演CVM绑定角色获取临时密钥请求。只支持在腾讯云CVM上部署的Grafana实例使用。SecretId, SecretKey API请求密钥,用于身份鉴权。获取地址前往API密钥管理。凭证类型为“永久密钥”或“Assume Role”时填写。 RoleArn 角色的资源描述,可在访问管理,点击角色名获取。凭证类型为“Assume Role”时填写。 角色名称 角色名称,可在访问管理获取。凭证类型为“CVM Role”时填写。必须与CVM绑定的角色名一致。 语言 插件展示语言 开启内网API模式 是否通过内网访问云API 在探索页开启展示类型选项 在探索页开启展示类型选项,控制探索页展示的图表类型 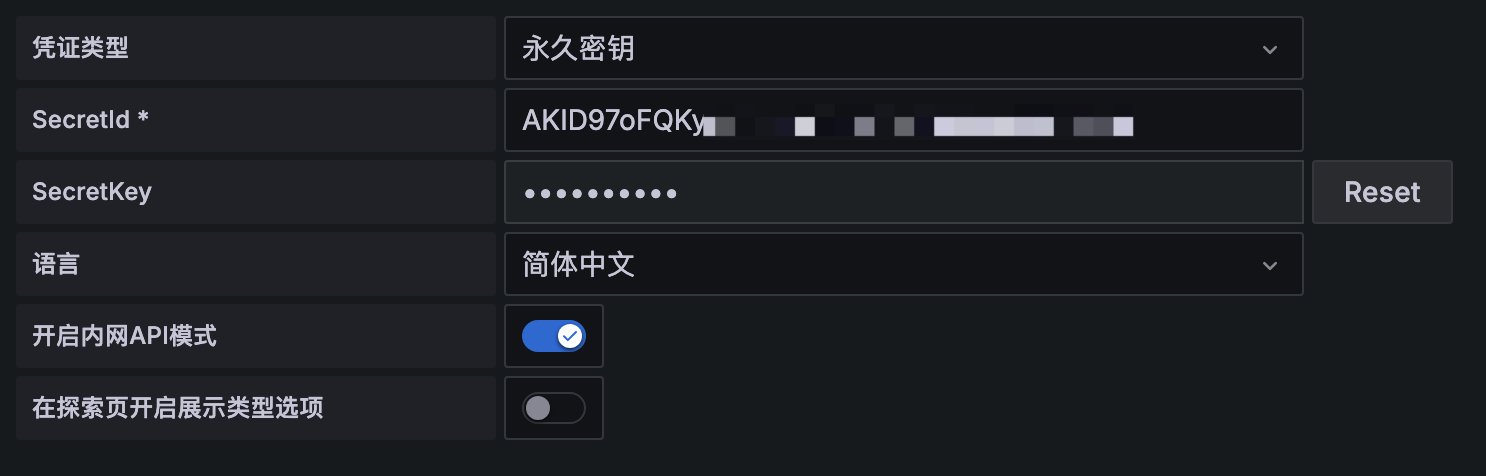
-
在左侧导航栏, Creat Dashboards,Dashboard页面Add new panel
-
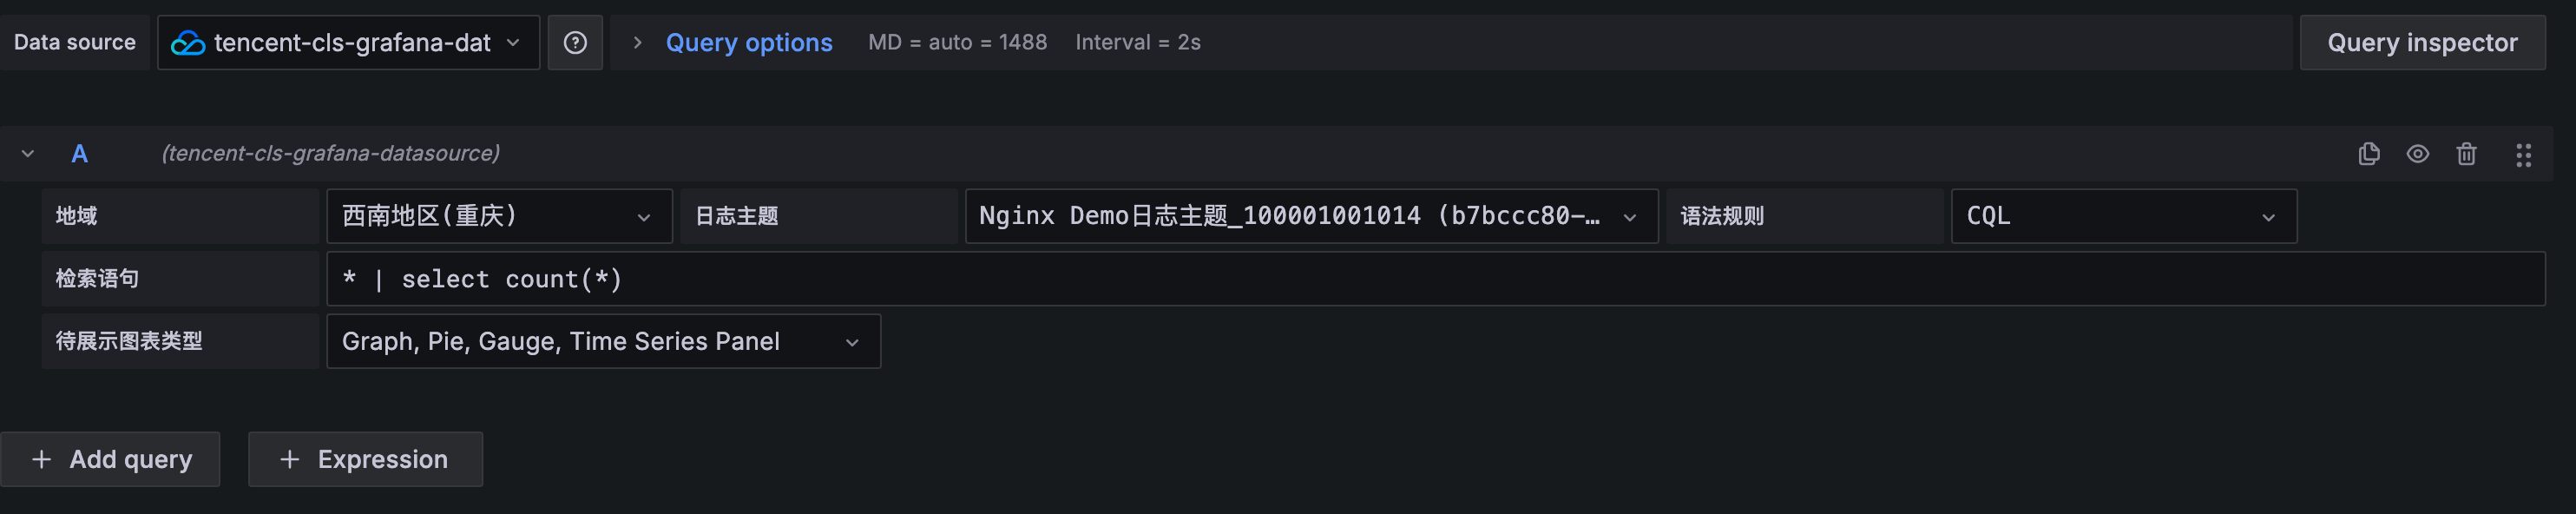
数据源选择用户刚刚新建的CLS datasource
-
用户输入Query语句,根据待展示图表类型,选择Format形式,系统会做数据转换以满足grafana展示需要。
Format格式 描述 配置项 Log Panel log panel is used to shown log search result. Query syntax supports searching by keyword, fuzzy match. For more information, see Syntax and Rules. Eg. status:400 limit:用于指定返回日志检索结果条数 Table Panel Table panel will automatically show the results of whatever columns and rows your query returns 无 Graph, Pie, Gauge,Time Series Panel In this pattern, there is a format transformation where data will be adapted to Graph, Pie, Gauge, Time Series Panel 无
展示pv,uv数据曲线
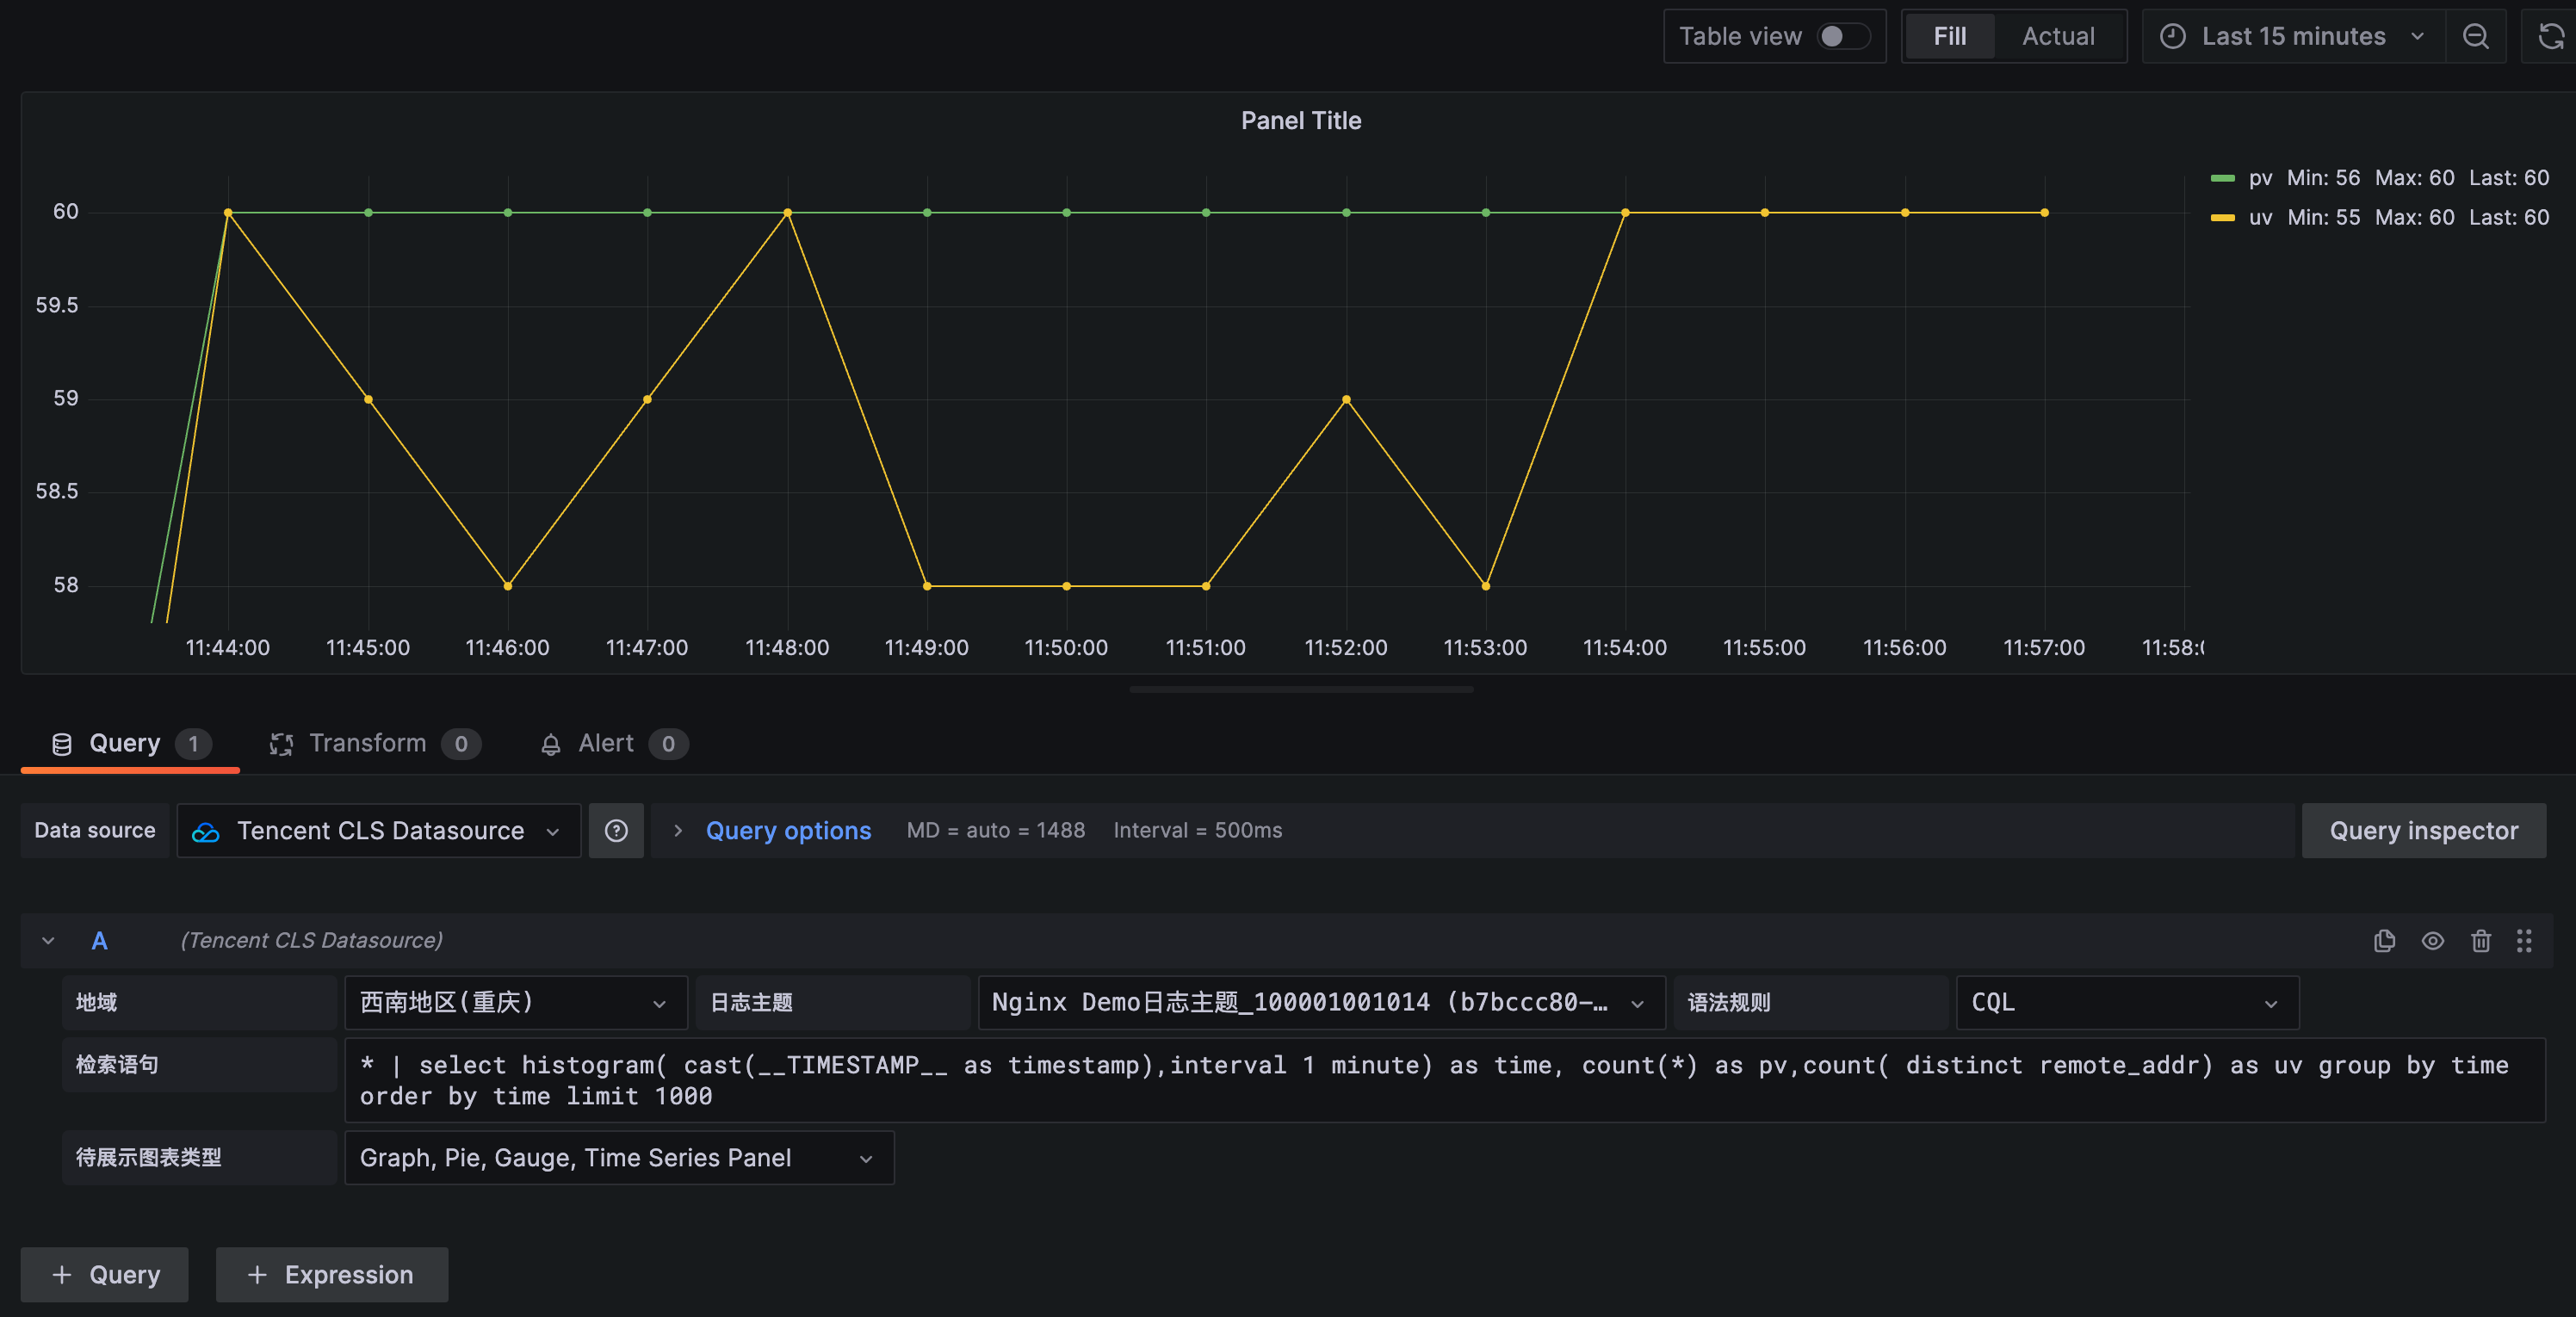
query语句:
* | select histogram( cast(__TIMESTAMP__ as timestamp),interval 1 minute) as time, count(*) as pv,count( distinct remote_addr) as uv group by time order by time limit 1000
Format:选择 Graph, Pie, Gauge, Time Series Panel
展示请求状态码分布
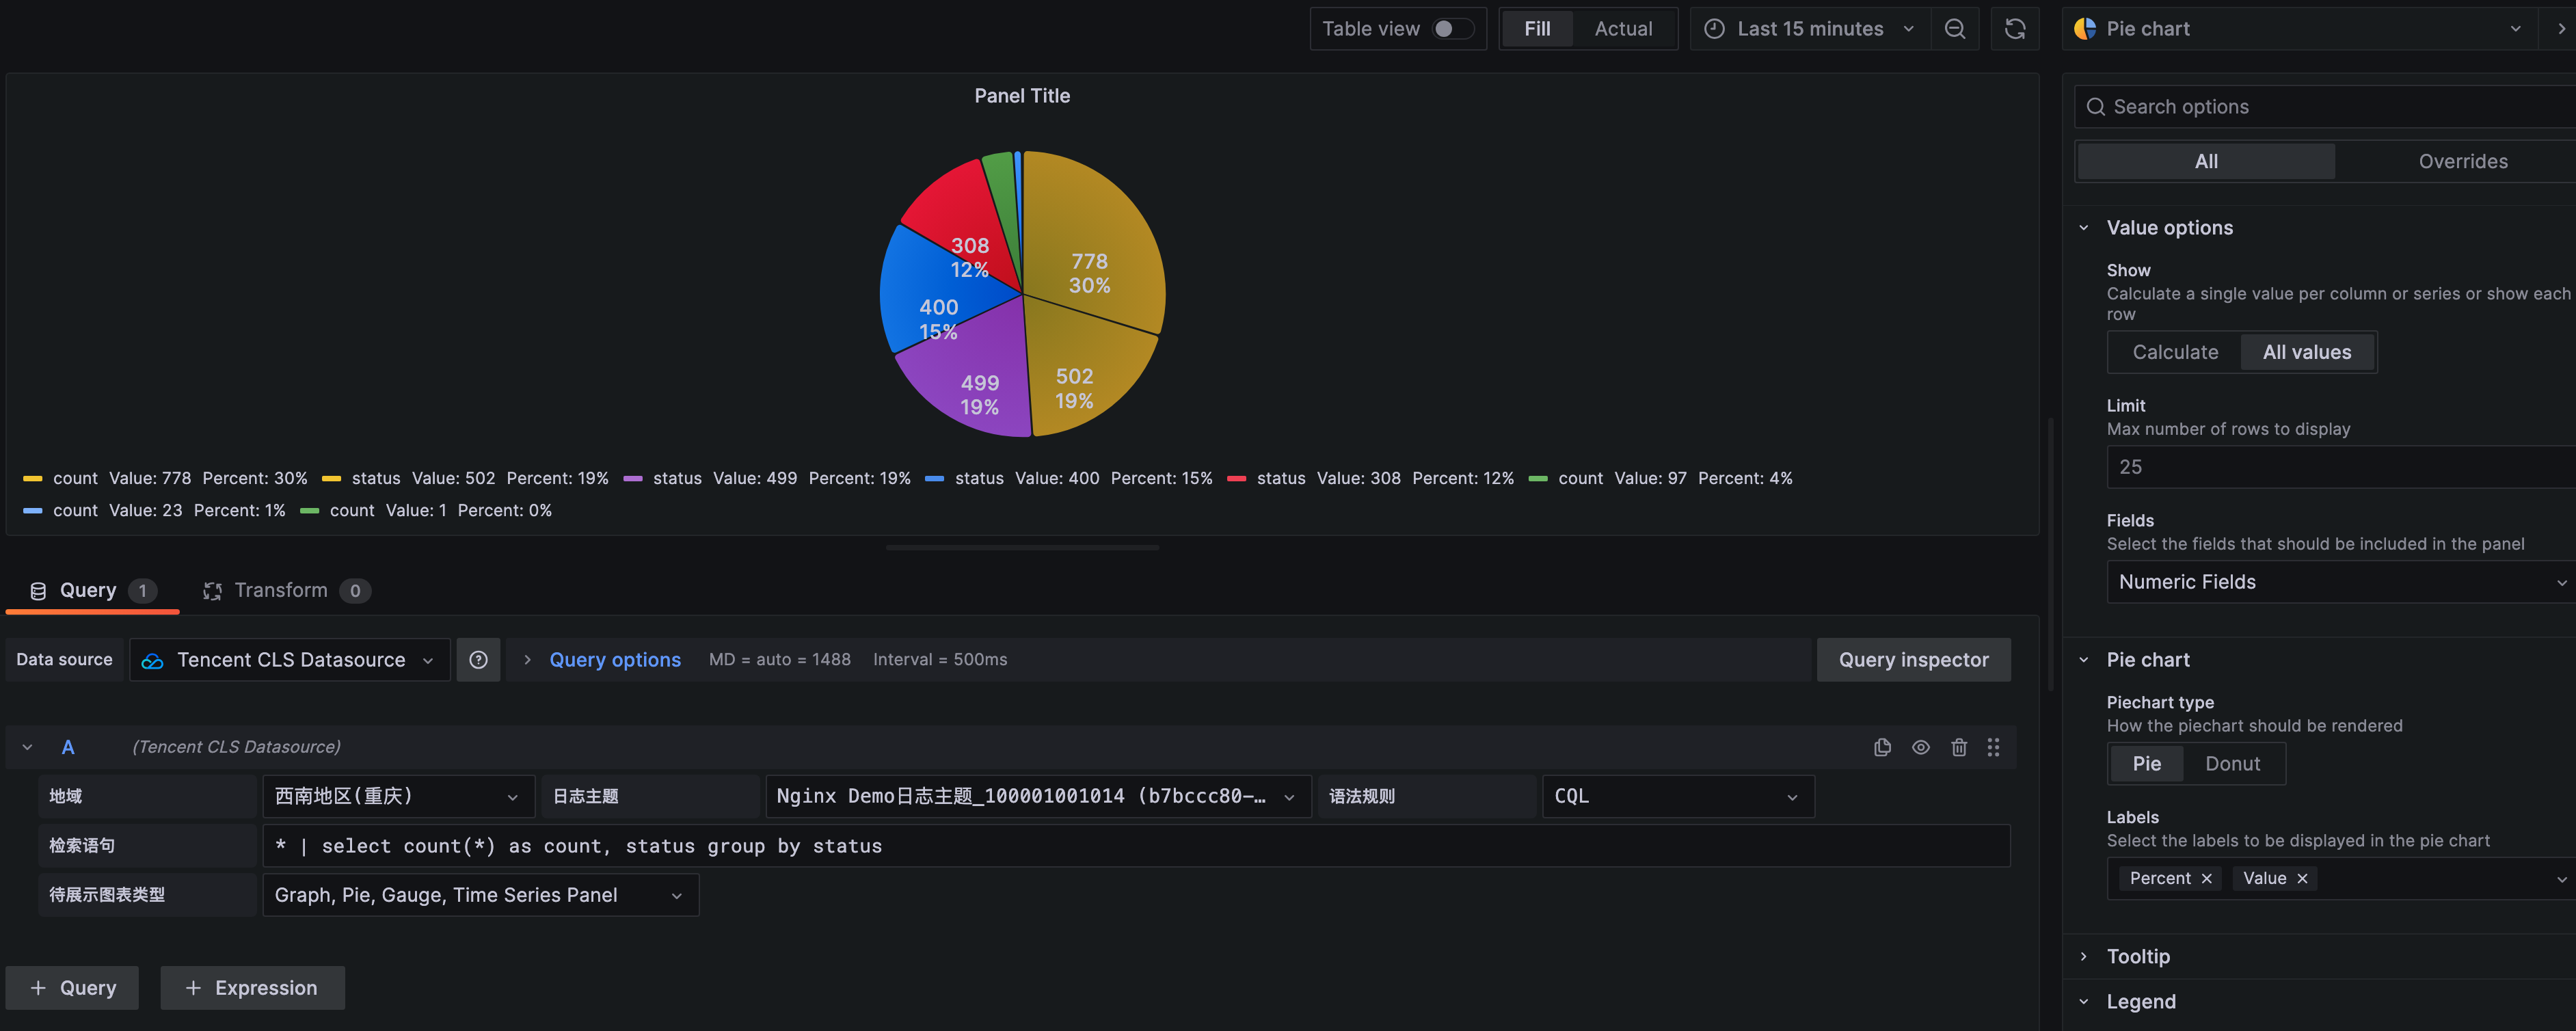
query语句:
* | select count(*) as count, status group by status
Format:选择 Graph, Pie, Gauge, Time Series Panel
统计访问延时前10页面
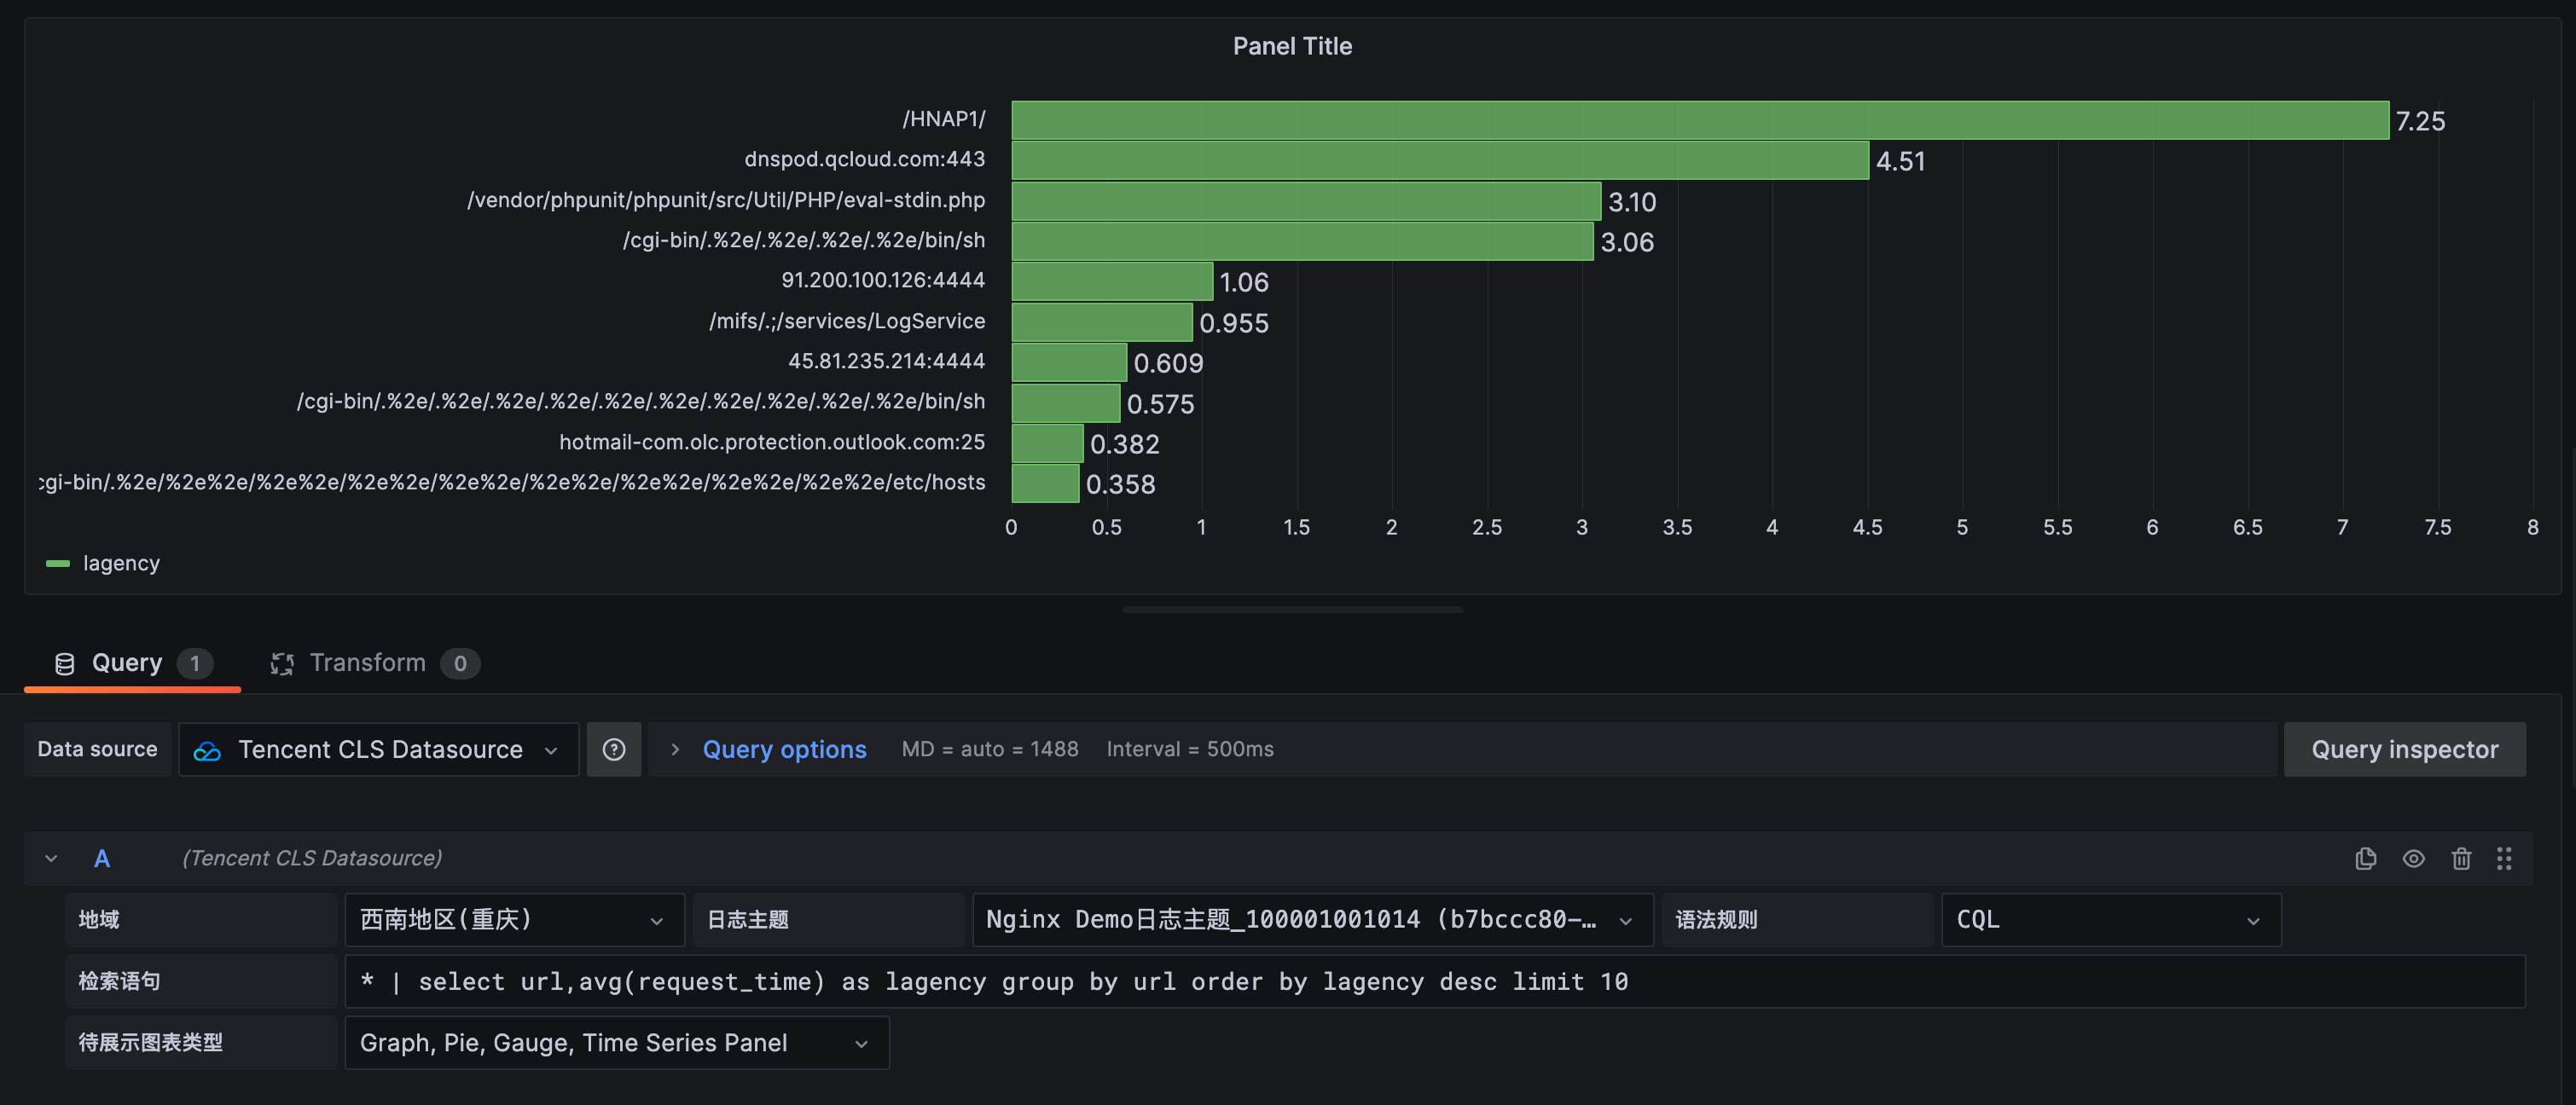
query语句:
* | select url, avg(request_time) as lagency group by url order by lagency desc limit 10
Format:选择 Graph, Pie, Gauge, Time Series Panel
展示访问量前10用户
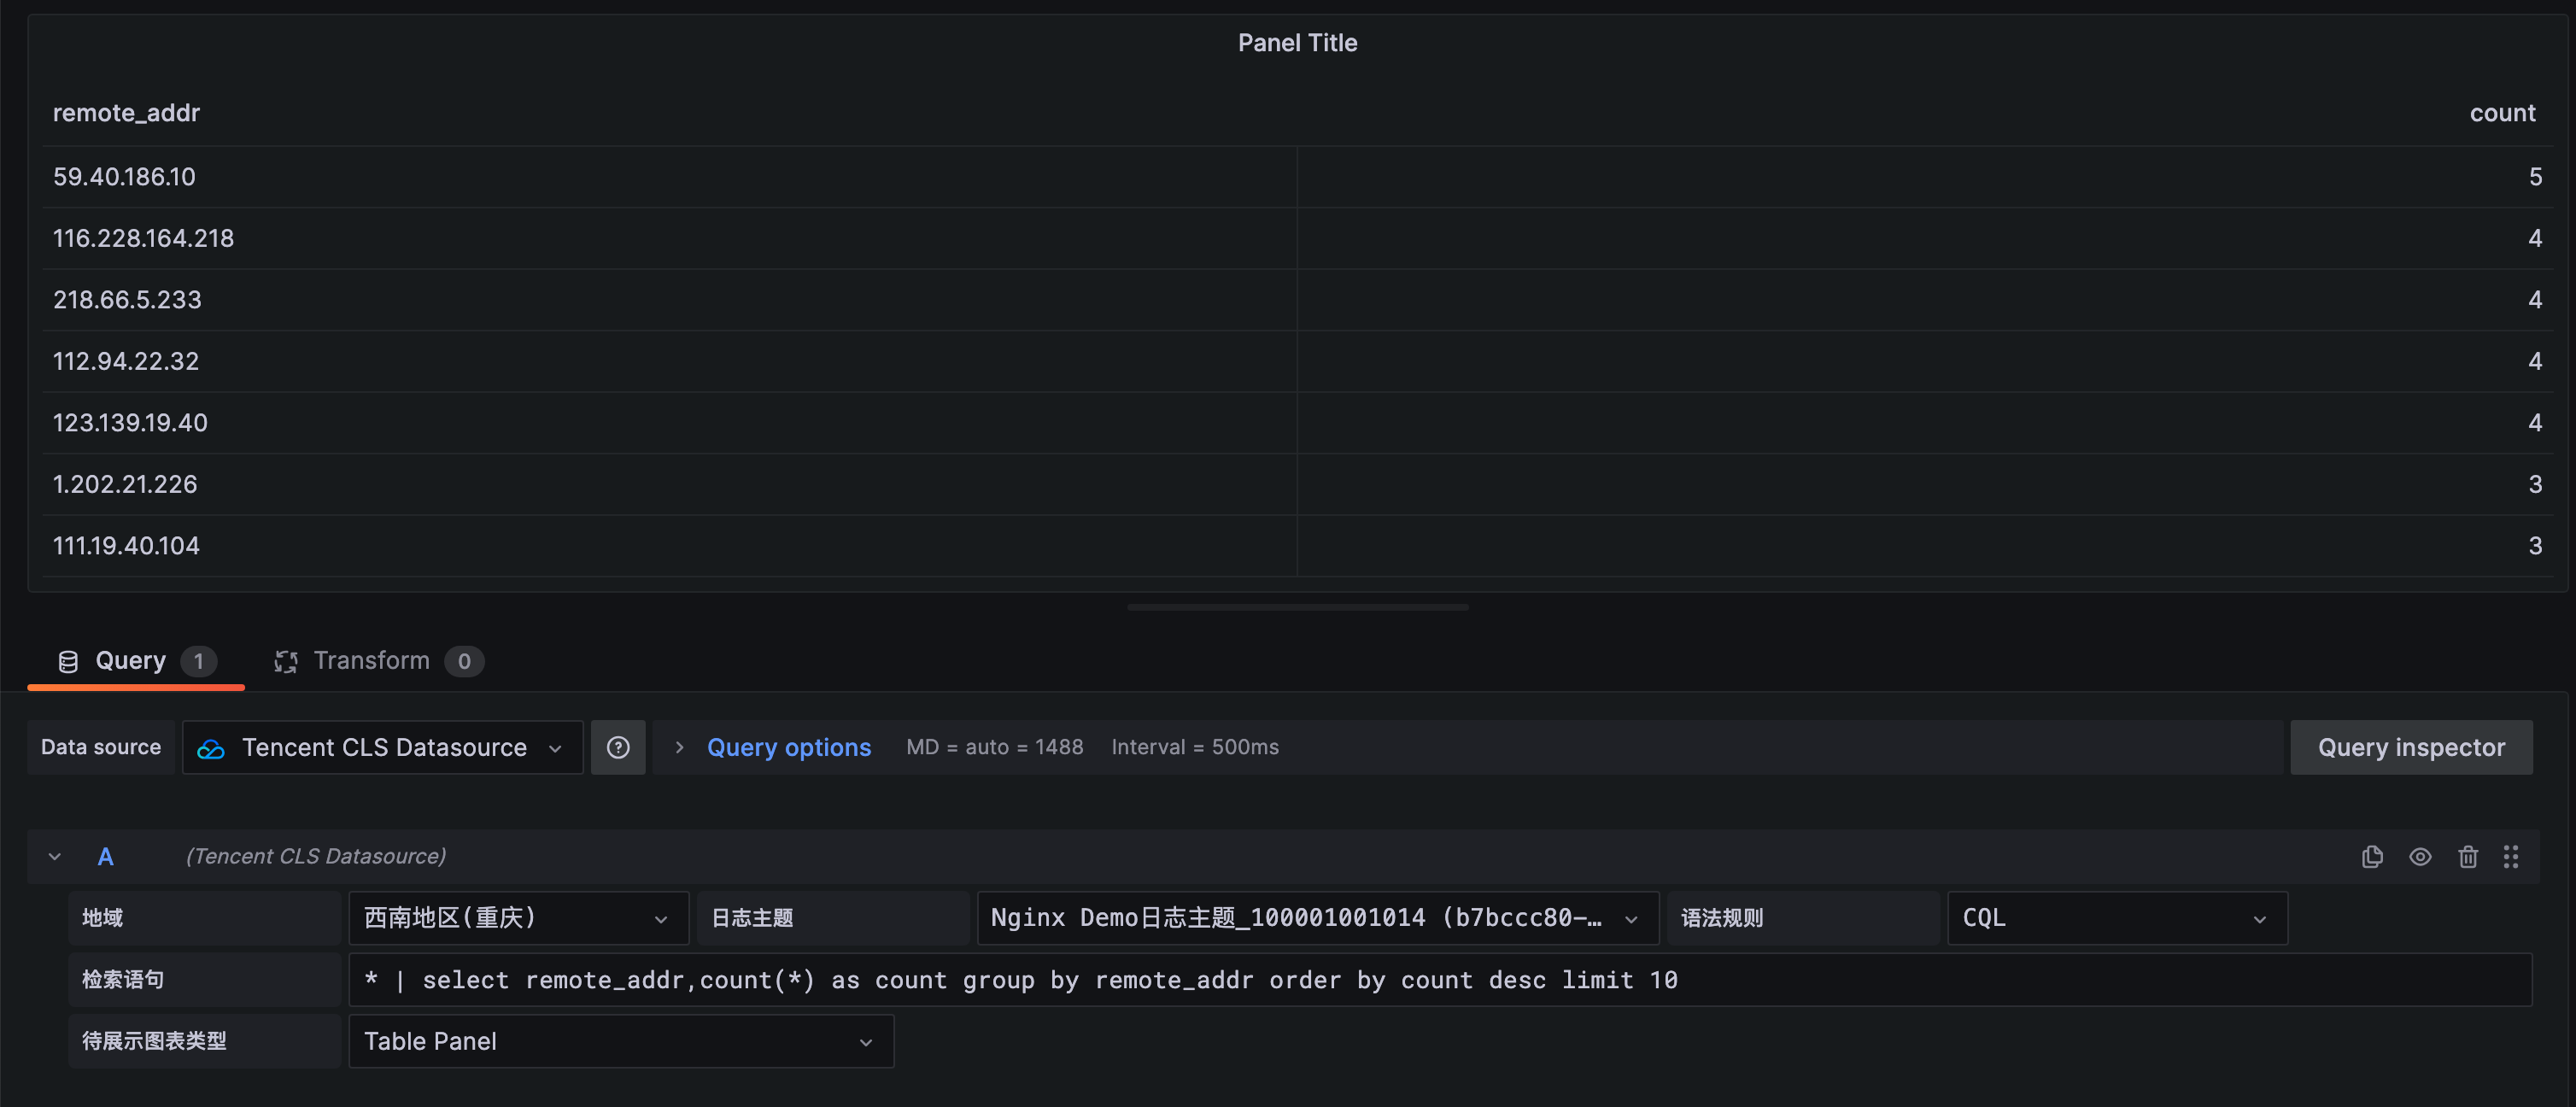
query语句:
* | select remote_addr,count(*) as count group by remote_addr order by count desc limit 10
Format:Table Panel
展示原始日志
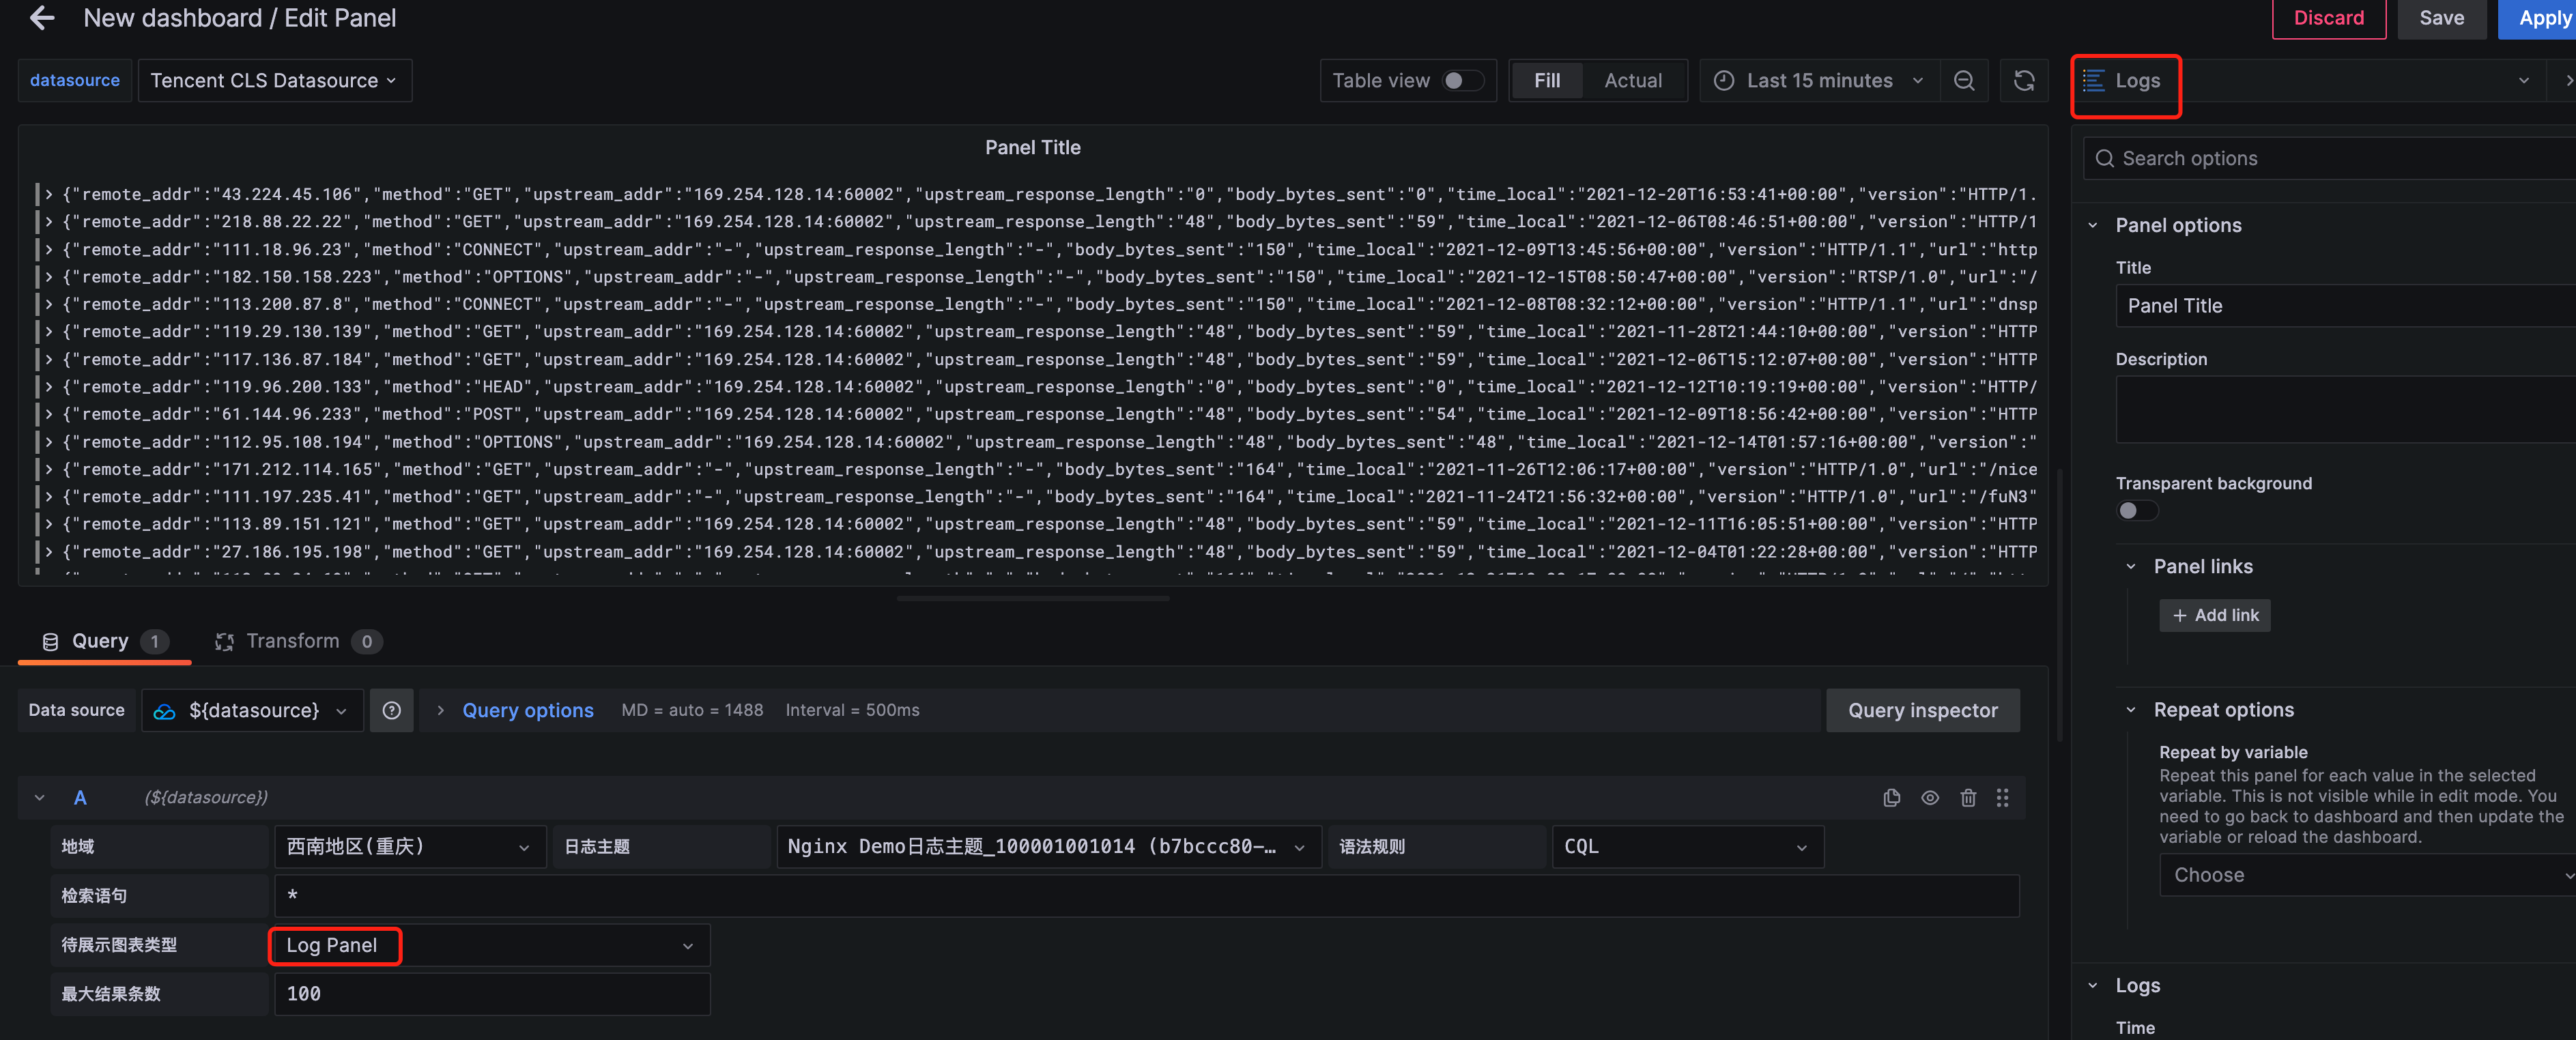
query语句:
*
Format:Log Panel
CLS 数据源插件支持使用模板变量功能,可参照 新增变量 文档,创建仪表盘中的变量并使用。 注意:使用模板变量的图表无法用于告警
这里就 Custom、Query、DataSources 类型变量给出一个使用示例, 其他变量类型使用上基本相同。
输入变量名 Interval, 选择类型为 Custom, 在Custom Options中,输入变量的可选项,不同选项间使用逗号分隔。如输入以下内容可得到图中所示选项。
1 MINUTE,5 MINUTE,15 MINUTE,30 MINUTE,1 HOUR,1 DAY

使用时,可参照实例中的 时间折线图Graph,将查询语句中的 1 minute 替换为 ${Interval}, 其他配置不变,查询Query中的变量将会被替换为选中的变量值。
* | select histogram( cast(__TIMESTAMP__ as timestamp),interval ${Interval}) as time, count(*) as pv group by time order by time
输入变量名 HttpStatus, 选择类型为 Query,在Query Options中,选择数据源为CLS数据源,刷新时间可选择 On Time Range Changed 或 On Dashboard Load。 输入如下的 Query 查询语句(请根据业务Topic进行修改),且可输入Regex对结果进行过滤,可选择Sort对结果进行排序。
* | select status

使用变量时,可通用以下语句进行查询
status:${HttpStatus}
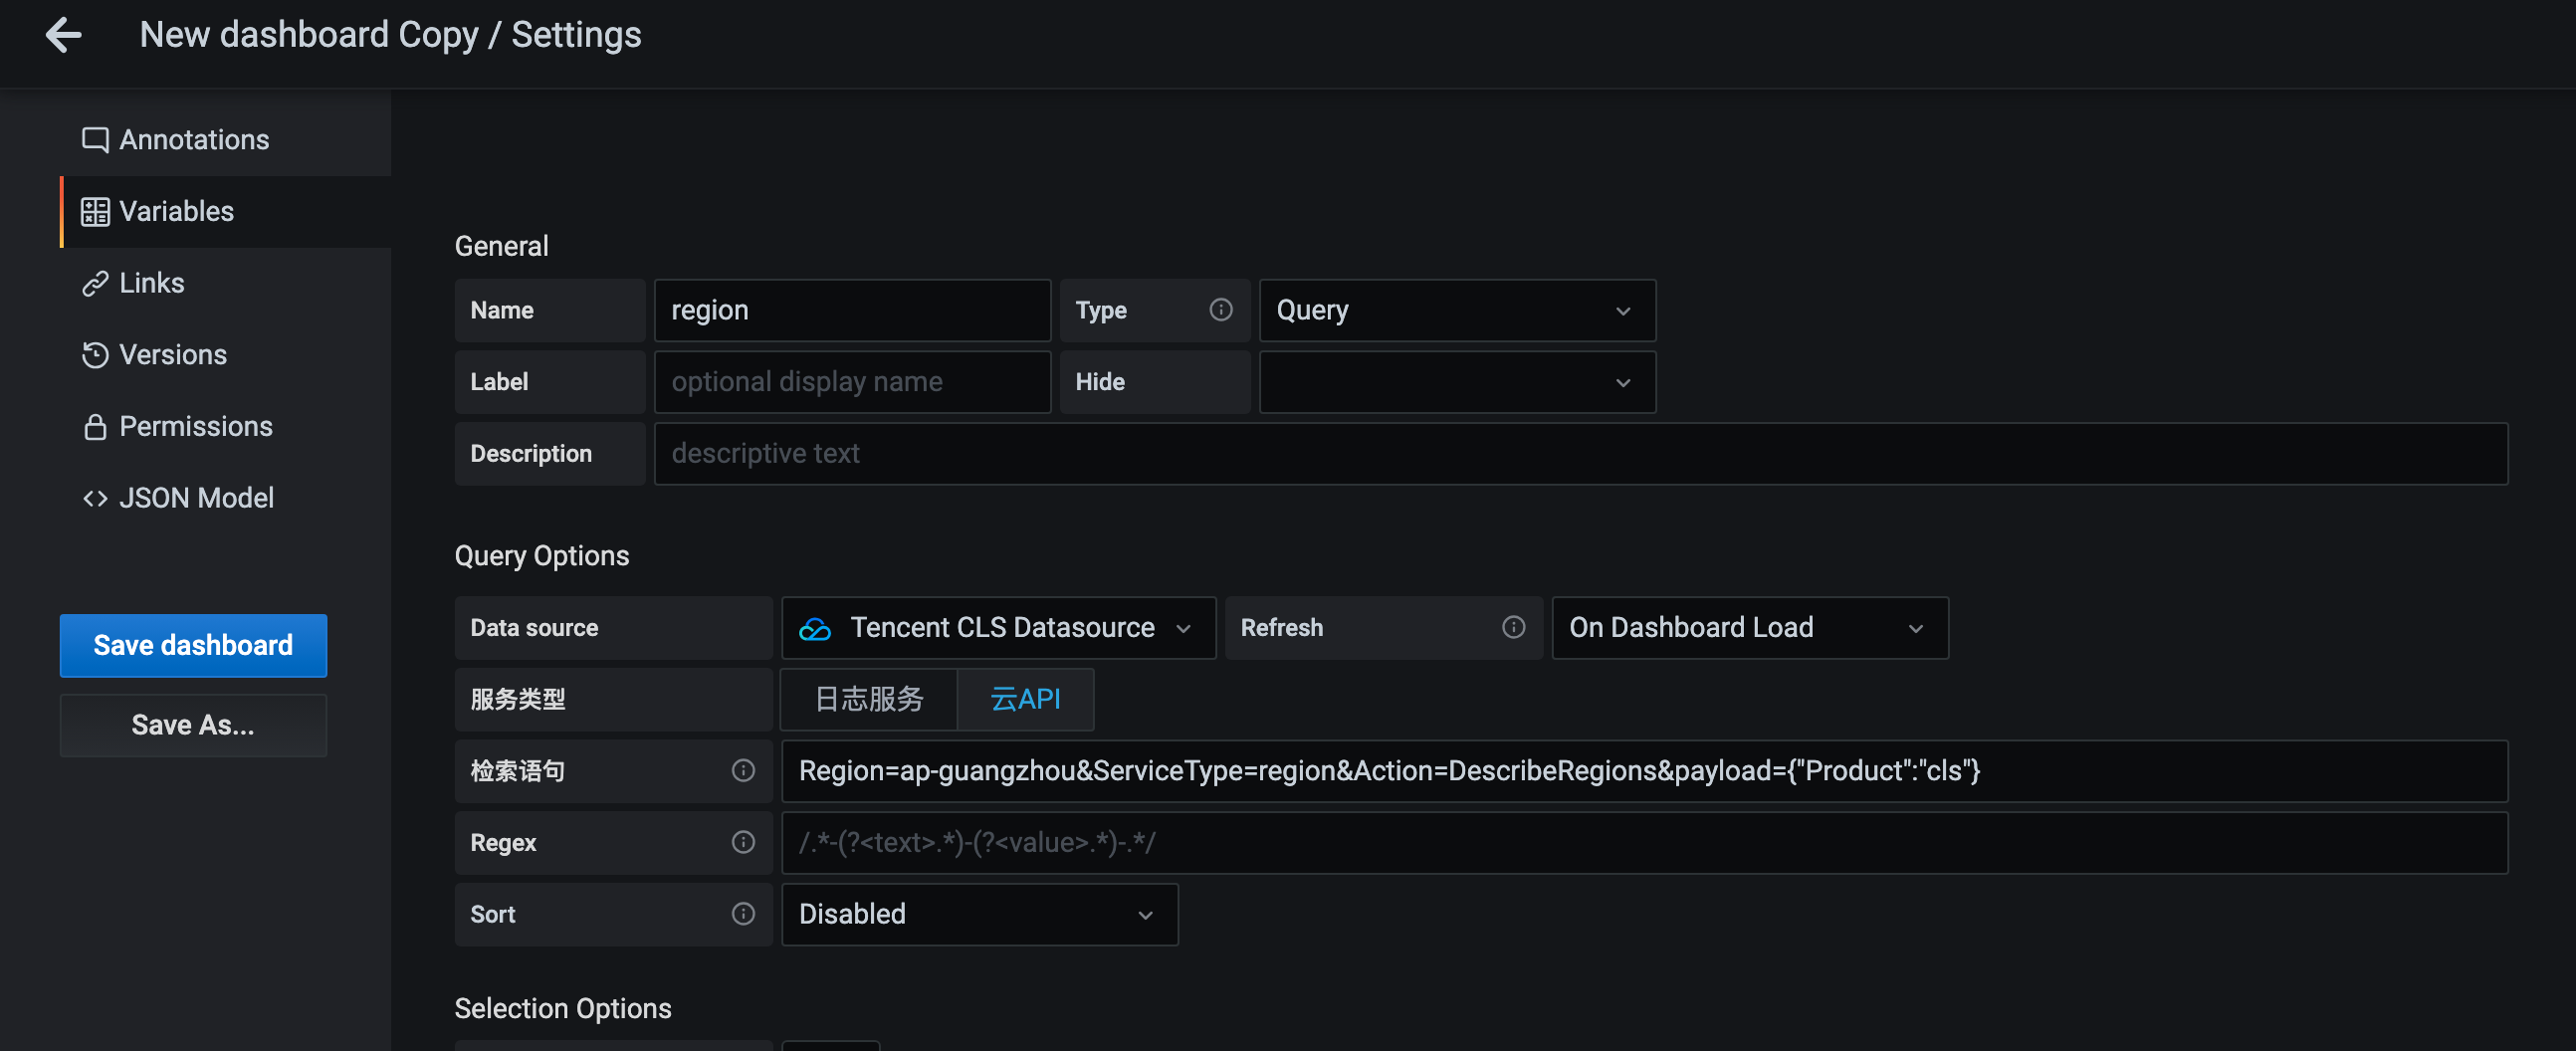
变量服务类型选择“云API”,支持变量下拉选项通过云API接口请求查询。只支持查询列表类接口。
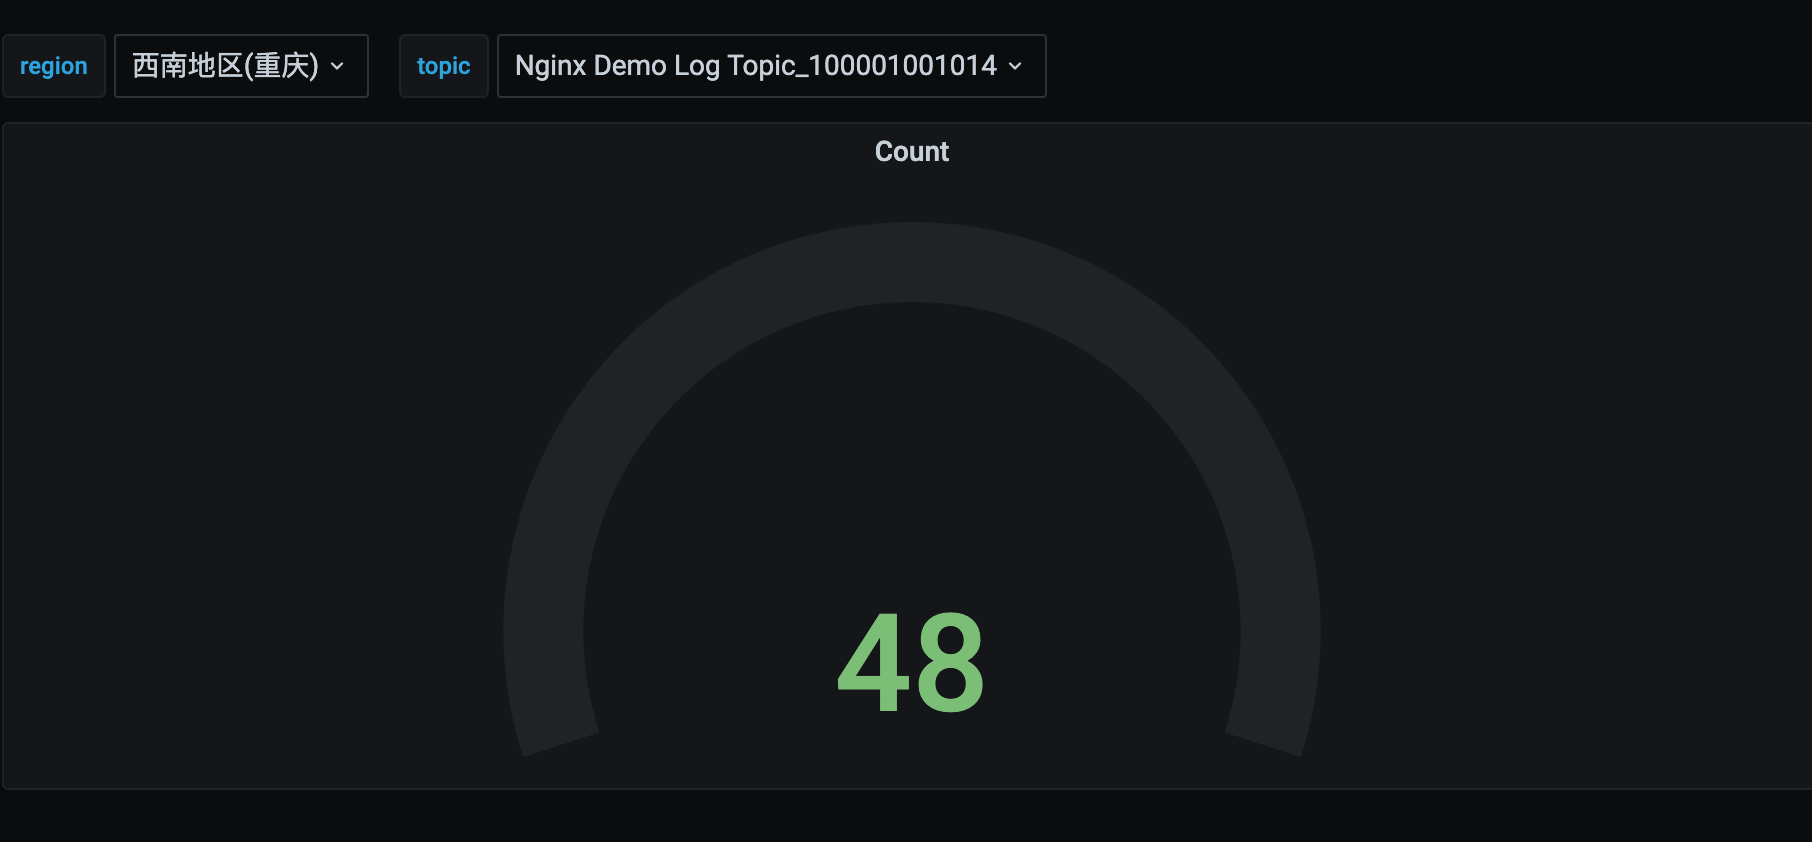
例如,配置 CLS地域变量(region) + 日志主题变量(topic)。
region:
ServiceType=region&Action=DescribeRegions&payload={"Product":"cls"}
topic(全部):
Region=${region}&ServiceType=cls&Action=DescribeTopics&field=Topics&id=TopicId&name=TopicName
topic(通过TopicName过滤):
Region=${region}&ServiceType=cls&Action=DescribeTopics&field=Topics&id=TopicId&name=TopicName&payload={"Filters":[{"Key":"topicName","Values":["your topic name"]}]}
语句参数说明:
Region(选填): 腾讯云地域,默认 ap-guangzhou
ServiceType(必填): 云API服务名/产品名,例如 cls
Action(必填):云API接口名称,例如 DescribeTopics
field(DescribeRegions接口无需填写,其他必填):列表返回数组字段名,例如 Topics
id(DescribeRegions接口无需填写,其他必填): 列表返回实例中ID字段名,例如 TopicId
name(DescribeRegions接口无需填写,其他必填):列表返回实例中实例名称字段名,例如 TopicName
payload(选填):其他需要传入云API接口中的参数,JSON字符串格式。例如 {"Filters":[{"Key":"topicName","Values":["your topic name"]}]}
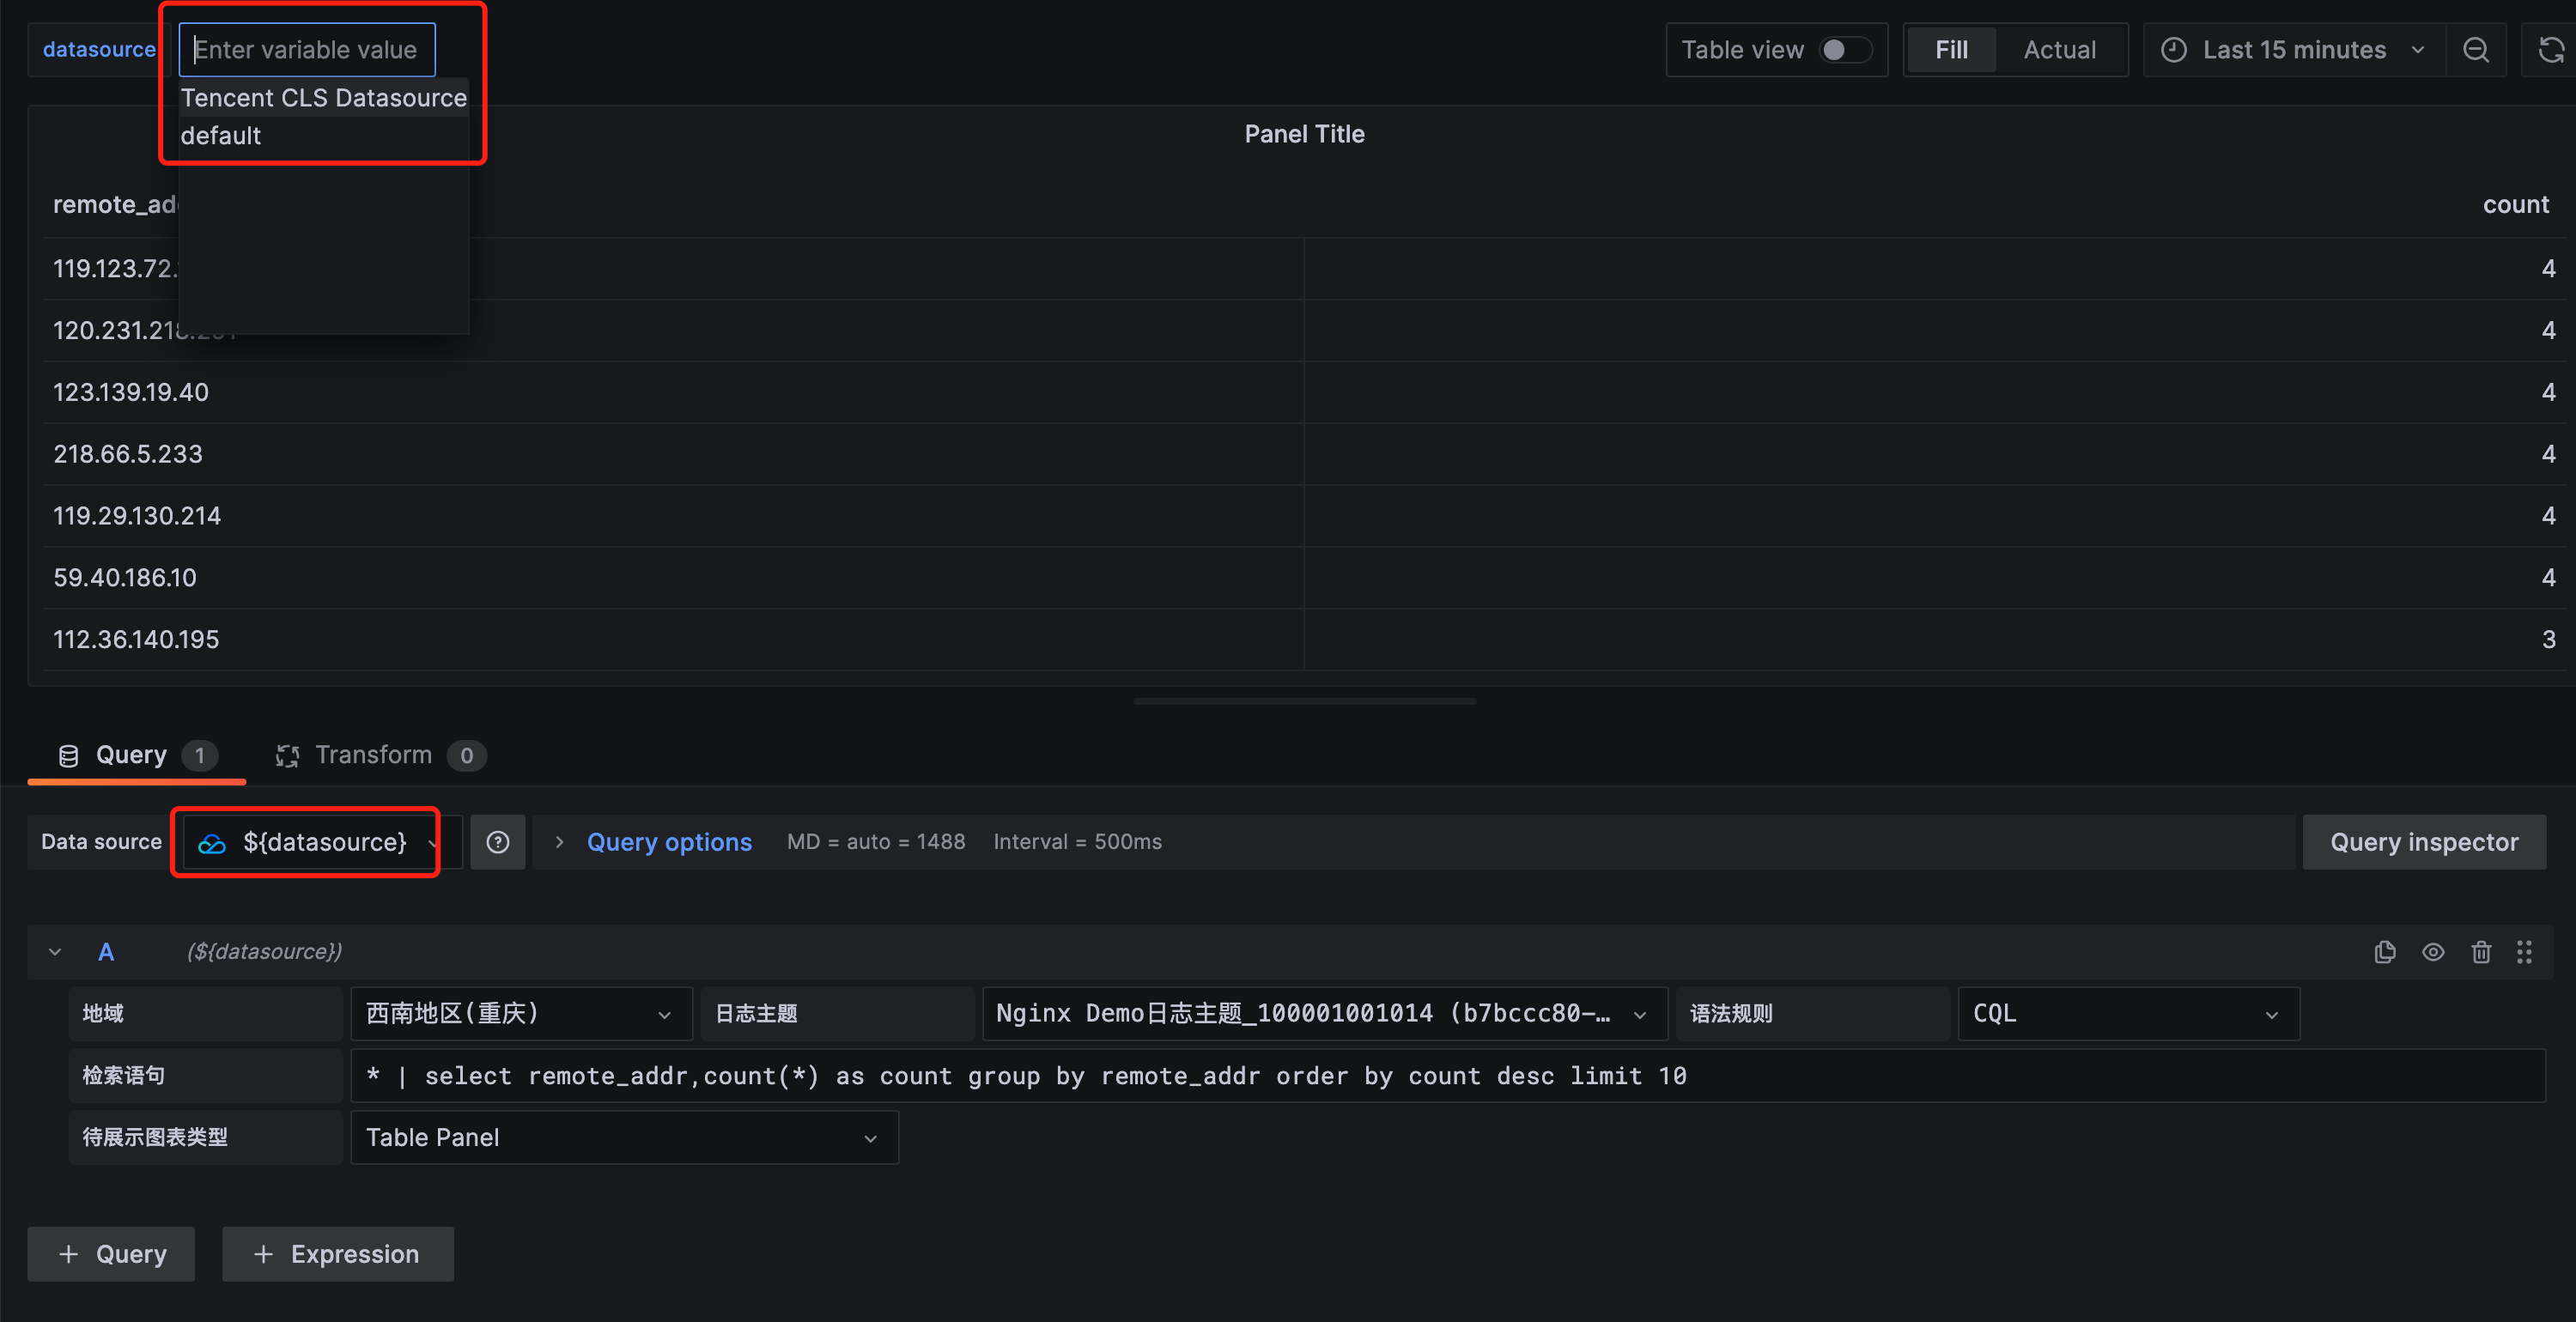
输入变量名 Datasource, 选中变量类型为 Datasource,在Data source options中配置 Type 为 Tencent CLS Datasource。 使用预览效果如下
注意:Datasource 类型变量仅适用于Grafana中存在多个索引配置相同(或相似)的CLS数据源的情况
- macOS系统日志路径:/usr/local/var/log/grafana/grafana.log
- Linux系统日志路径:/var/log/grafana/grafana.log
- 问题排查:https://grafana.com/docs/grafana/latest/troubleshooting/
- 腾讯云日志服务官网文档:https://cloud.tencent.com/document/product/614/52102